Starting from October 2025, export schedule data from steel mills has been added. The planned production of rebar and wire rod includes exports but excludes steel billet exports.
According to SMM survey data from 56 key steel producers:
- The planned rebar production in April was 8.0385 million mt, an increase of 103,500 mt or 1.30% from the actual production in March.
- The planned wire rod production in April was 2.9614 million mt, a decrease of 128,700 mt or 4.16% from the actual production in March.
Chart-1-2: Planned Production of Rebar & Wire Rod at Main Construction Steel Mills (56 mills)
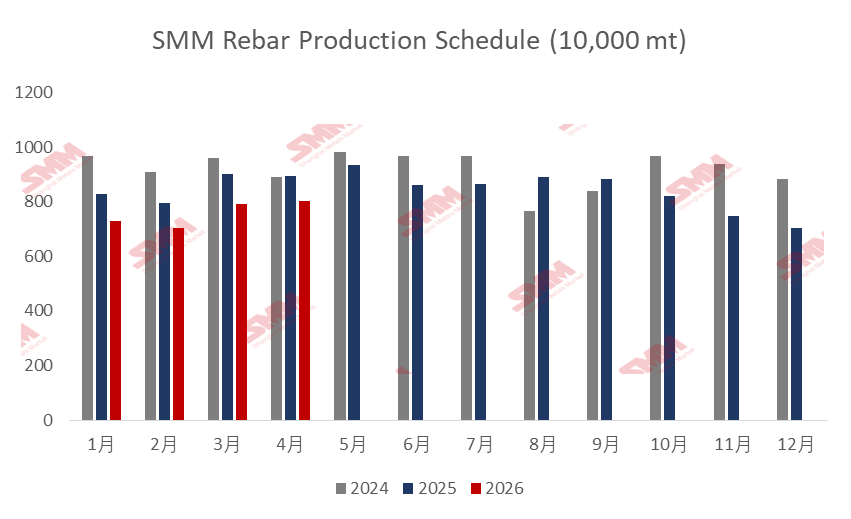
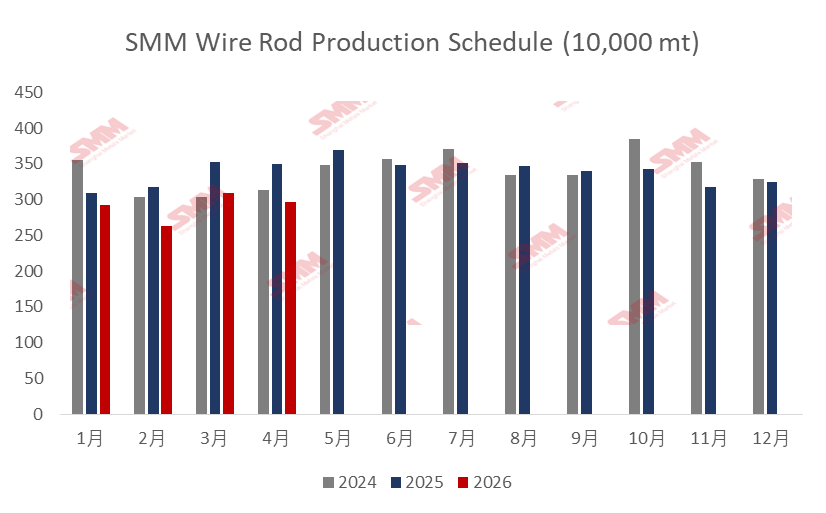
Data source: SMM
- In April, the long product export scheduled production of sample steel mills was 791,000 mt, up 79,000 mt MoM, of which the steel billet export scheduled production was 420,000 mt, up 110,000 mt MoM.
Chart-3: Export Schedule of Long Products from Sample Steel Mills
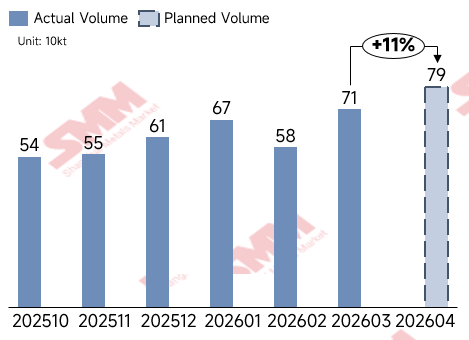
Data source: SMM
Overall:
In March, national construction steel prices moved sideways. Geopolitical issues outside China caused raw material price fluctuations, but the impact on finished steel prices was relatively small. Additionally, peak-season demand in March fell slightly short of expectations, with weak fundamentals-driven momentum, resulting in relatively small overall price fluctuations. Cost side, stronger energy prices supported firmer raw material prices, but rebar price gains were relatively limited, leading to greater losses for steel mills producing mid-range specifications. However, at this stage, many steel mills have adjusted their premium pricing policies and prioritized production of premium-priced specifications to improve in-house profitability. In April, the steel mill profit rate stood at 43%, actually increasing MoM. Current profitability levels generally ranged between (-100-100).
Steel mills that underwent maintenance earlier have largely resumed normal levels in April, with daily average planned production of construction steel showing increases. However, steel mills have adjusted their product mix, with planned production by product showing rebar increases and wire rod decreases. Specifically, in the northwest and north China regions, some steel mills plan to reduce or conduct maintenance on wire rod production lines in April due to weak wire rod sales performance. In east China, some steel mills have reduced wire rod production accordingly as they increased steel billet export volumes.
Table 1: Actual Values of Rebar and Coiled Rebar Production Schedule Last Month and Planned Volume This Month
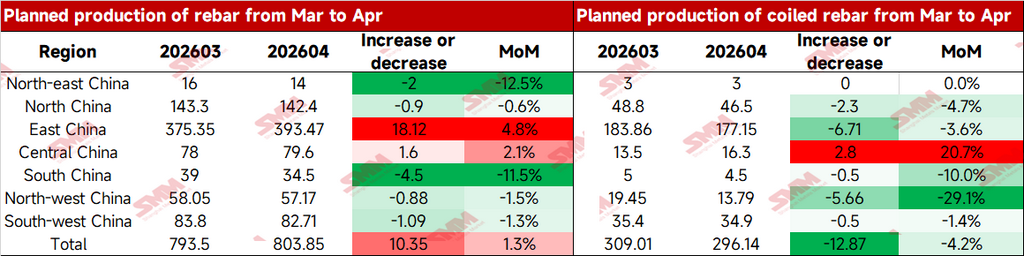
Data Source: SMM
Looking ahead, some steel mills saw plate rolling profitability largely on par with rebar profitability for premium-priced specifications, and plan to maintain the previous production pace in the short term. Additionally, as steel mills in the northwest and north China experienced weak wire rod demand, they plan to prioritize destocking existing wire rod inventory in the short term, with limited enthusiasm for wire rod production in April. As a result, April planned production at steel mills shows an increase in rebar and a decrease in wire rod.
Furthermore, steel mills in the northeast and east China both saw increases in steel billet export volumes, with orders already booked through June-July, and thus plan to continue controlling finished steel product volumes going forward. Overall, the MoM change in total planned construction steel production at steel mills in April was relatively small, but compared with production schedule data over the past two years, it remains at a low level. The room for further reduction in construction steel production in May is expected to be relatively small, with daily production most likely to stay at the current level.
![[SMM Iron & Steel] Turkey’s Wire Rod Exports Decline 10.4% in Jan-Apr 2026 as Romanian Demand Collapses](https://imgqn.smm.cn/usercenter/aPBtI20251217171717.jpg)
![[SMM Analysis] Construction Steel Demand Pulled Back Seasonally This Period](https://imgqn.smm.cn/usercenter/UqlZJ20251217171717.jpg)