On March 31, 2026, the Service Industry Survey Center of the National Bureau of Statistics and the China Federation of Logistics and Purchasing released China’s PMI. In response, Huo Lihui, Chief Statistician of the Service Industry Survey Center of the National Bureau of Statistics, provided an interpretation. In March, the manufacturing PMI, the non-manufacturing business activity index, and the composite PMI output index all returned to expansion territory, registering 50.4%, 50.1%, and 50.5%, respectively, up 1.4, 0.6, and 1 percentage points MoM, indicating a rebound in the level of economic prosperity in China.
China PMI Performance in March 2026
I. Performance of China’s Manufacturing PMI
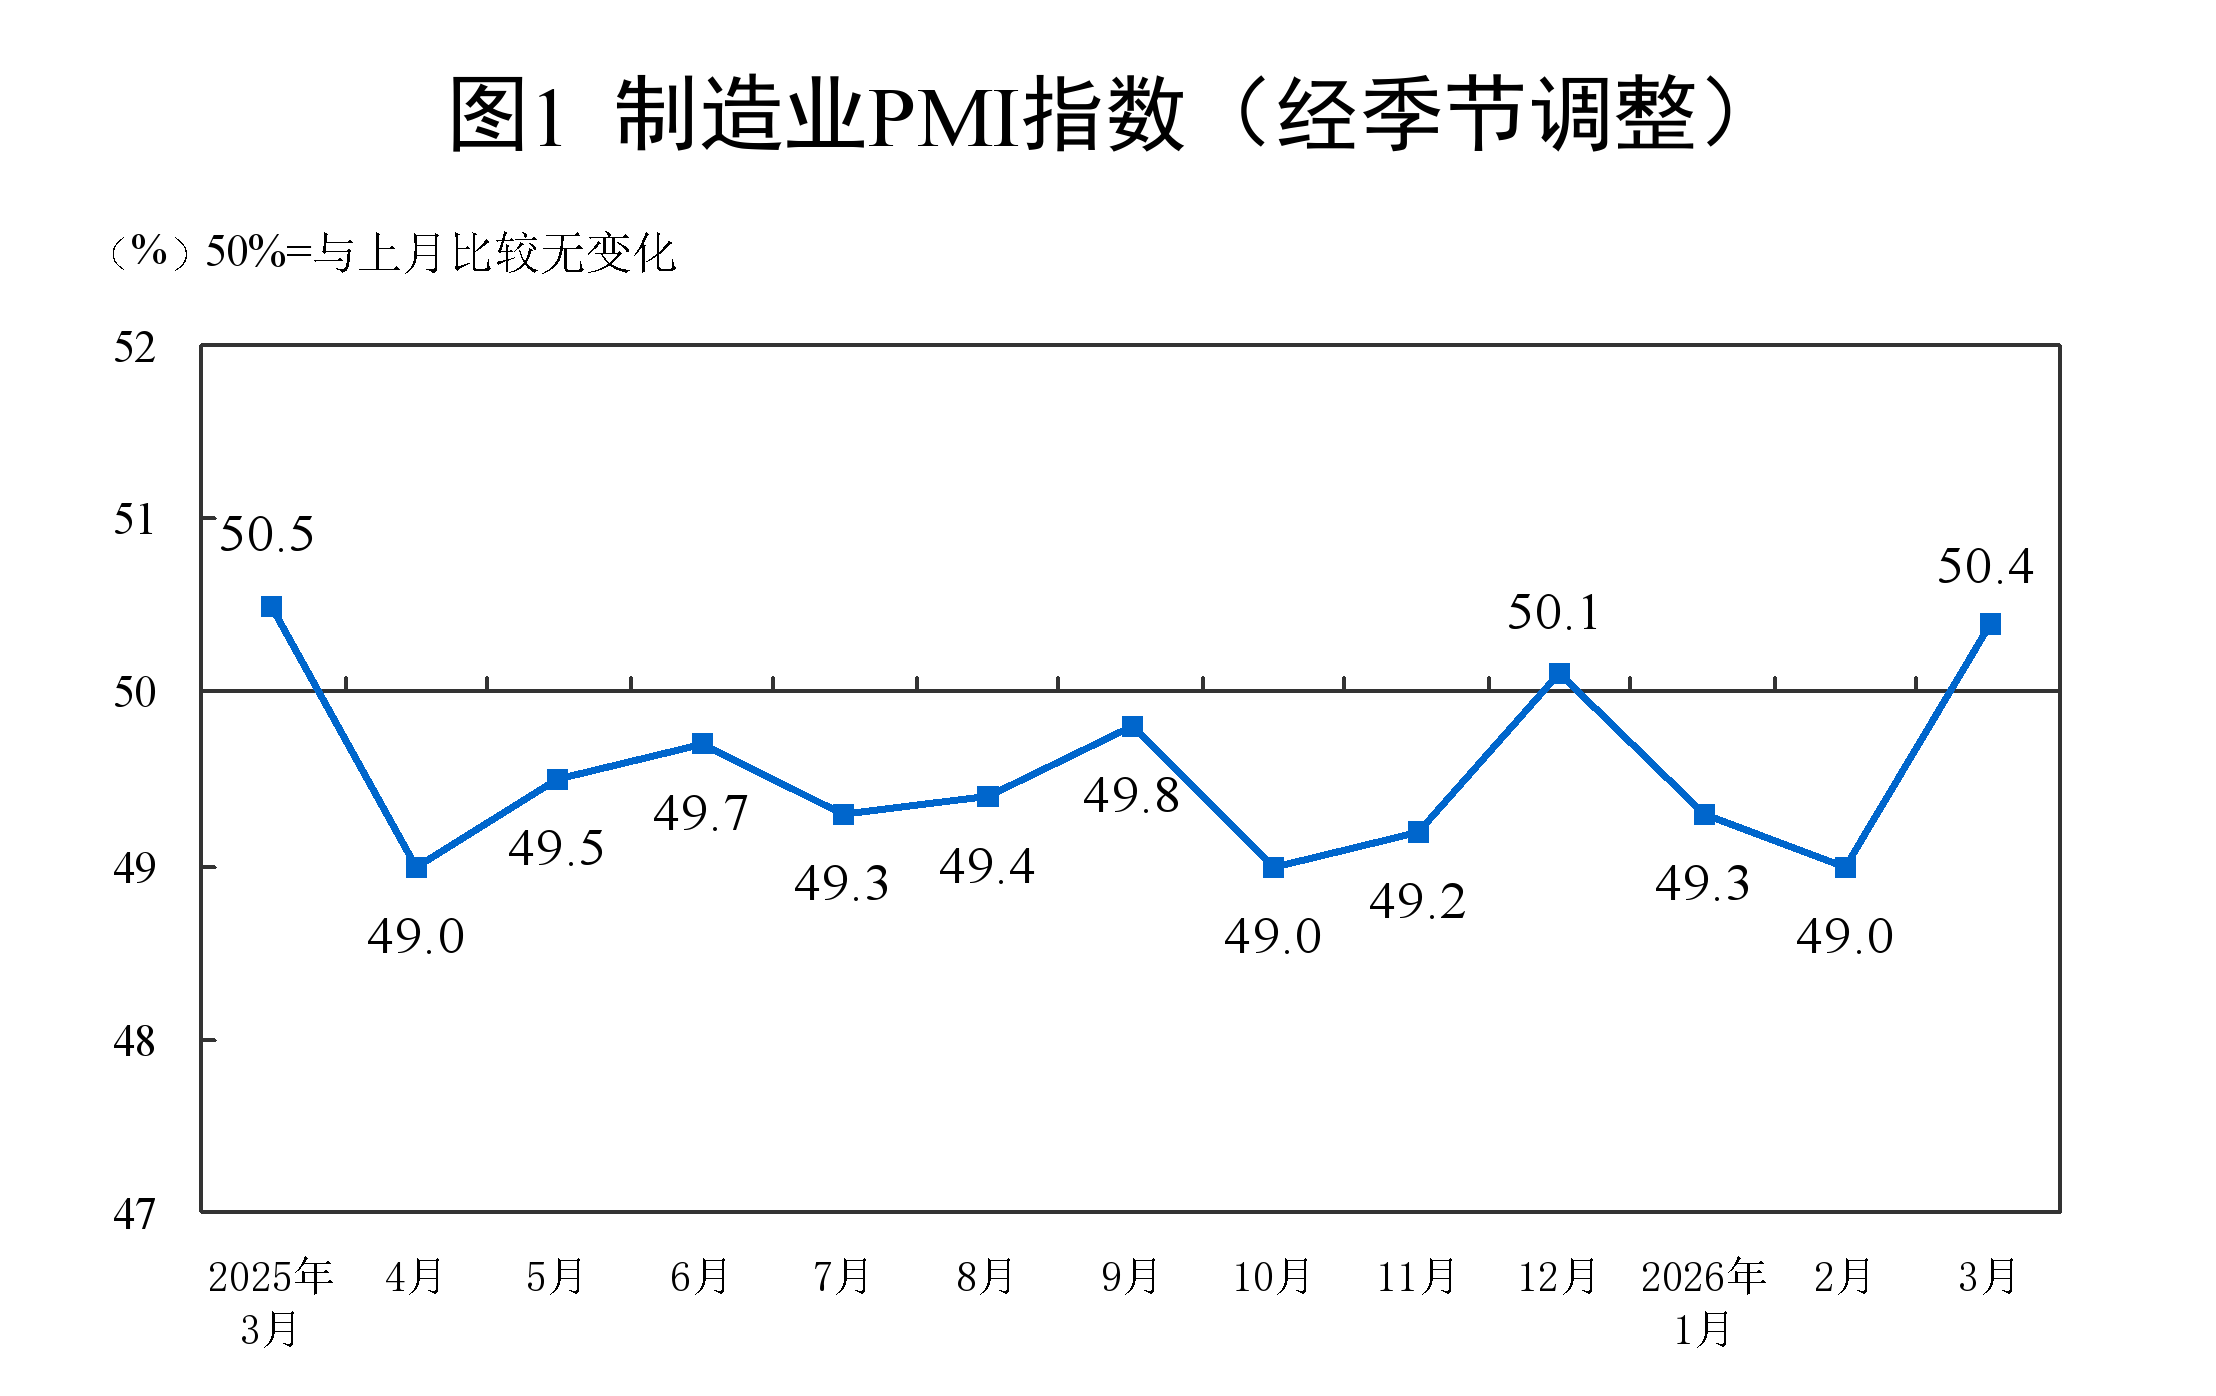
In March, the manufacturing PMI stood at 50.4%, up 1.4 percentage points MoM and above the threshold, indicating a rebound in the prosperity level of the manufacturing sector.
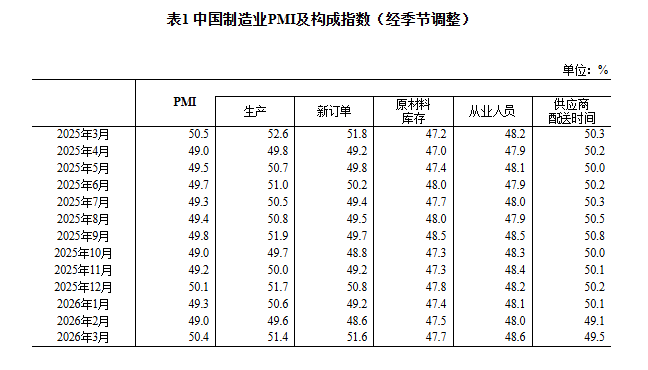
By enterprise size, the PMI of large enterprises was 51.6%, up 0.1 percentage points MoM and above the threshold; the PMI of medium-sized and small enterprises was 49.0% and 49.3%, respectively, up 1.5 and 4.5 percentage points MoM, but still below the threshold.
By sub-index, among the five sub-indices comprising the manufacturing PMI, the production index and the new orders index were both above the threshold, while the raw material inventory index, the employment index, and the supplier delivery time index were all below the threshold.
The production index was 51.4%, up 1.8 percentage points MoM, indicating faster manufacturing production activity.
The new orders index was 51.6%, up 3.0 percentage points MoM, indicating a marked improvement in the prosperity level of market demand in the manufacturing sector.
The raw material inventory index was 47.7%, up 0.2 percentage points MoM, indicating that the decline in inventories of major raw materials in the manufacturing sector narrowed somewhat.
The employment index was 48.6%, up 0.6 percentage points MoM, indicating a rebound in the employment climate of manufacturing enterprises.
The supplier delivery time index was 49.5%, up 0.4 percentage points MoM and below the threshold, indicating that delivery times of raw material suppliers in the manufacturing sector lengthened compared with the previous month.
II. Performance of China’s Non-Manufacturing PMI
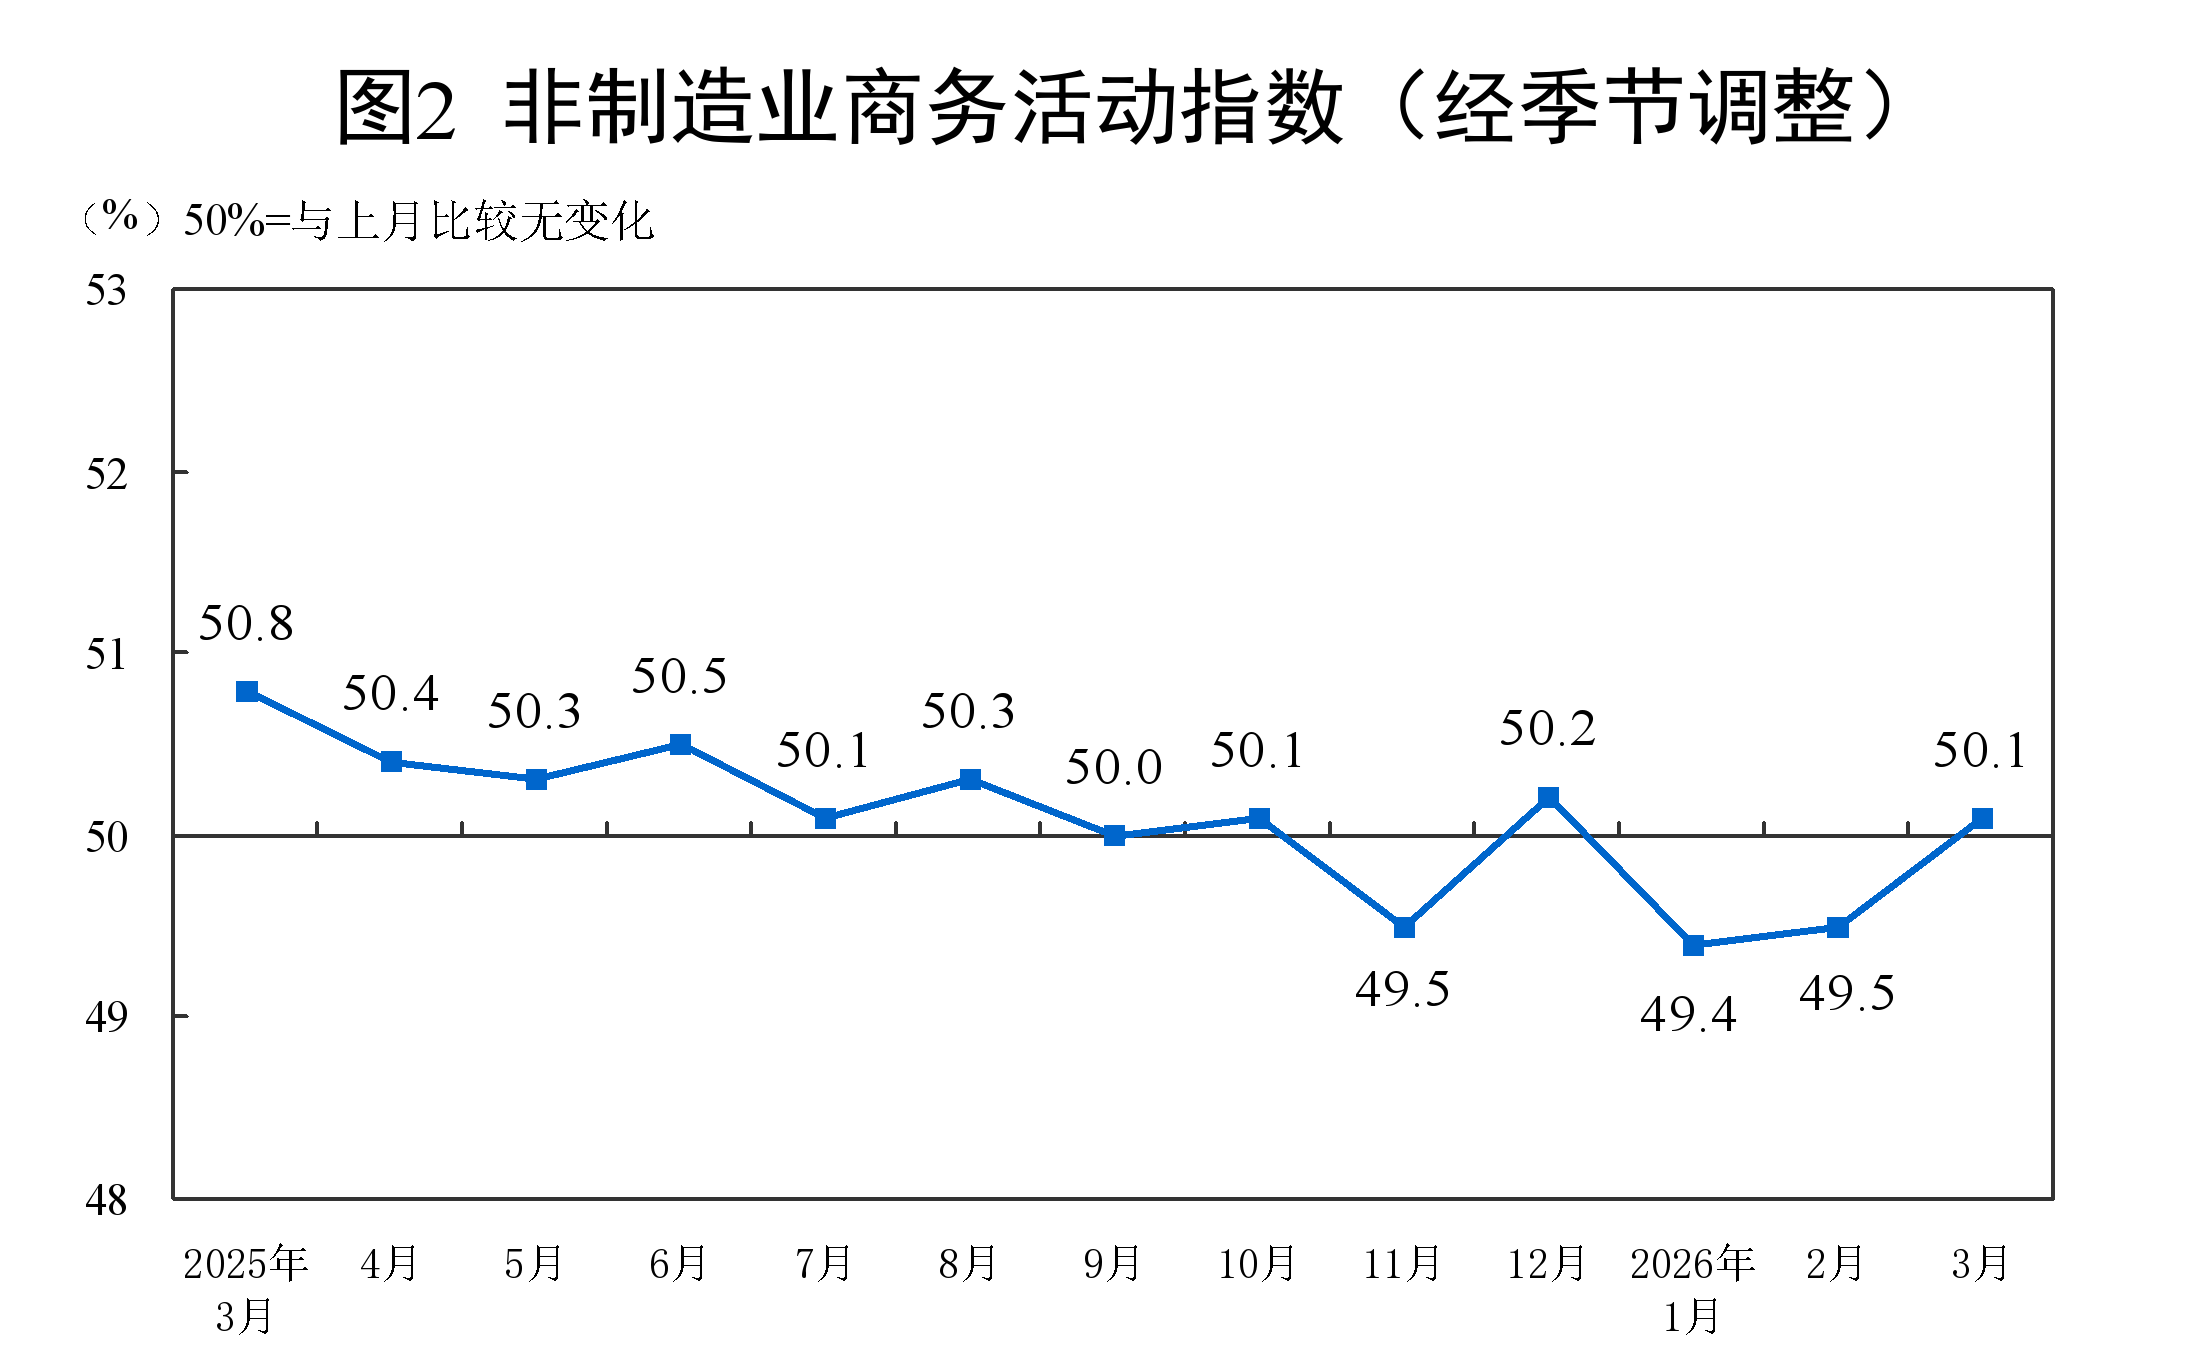
In March, the non-manufacturing business activity index was 50.1%, up 0.6 percentage points MoM and above the threshold, indicating some improvement in the prosperity level of the non-manufacturing sector.
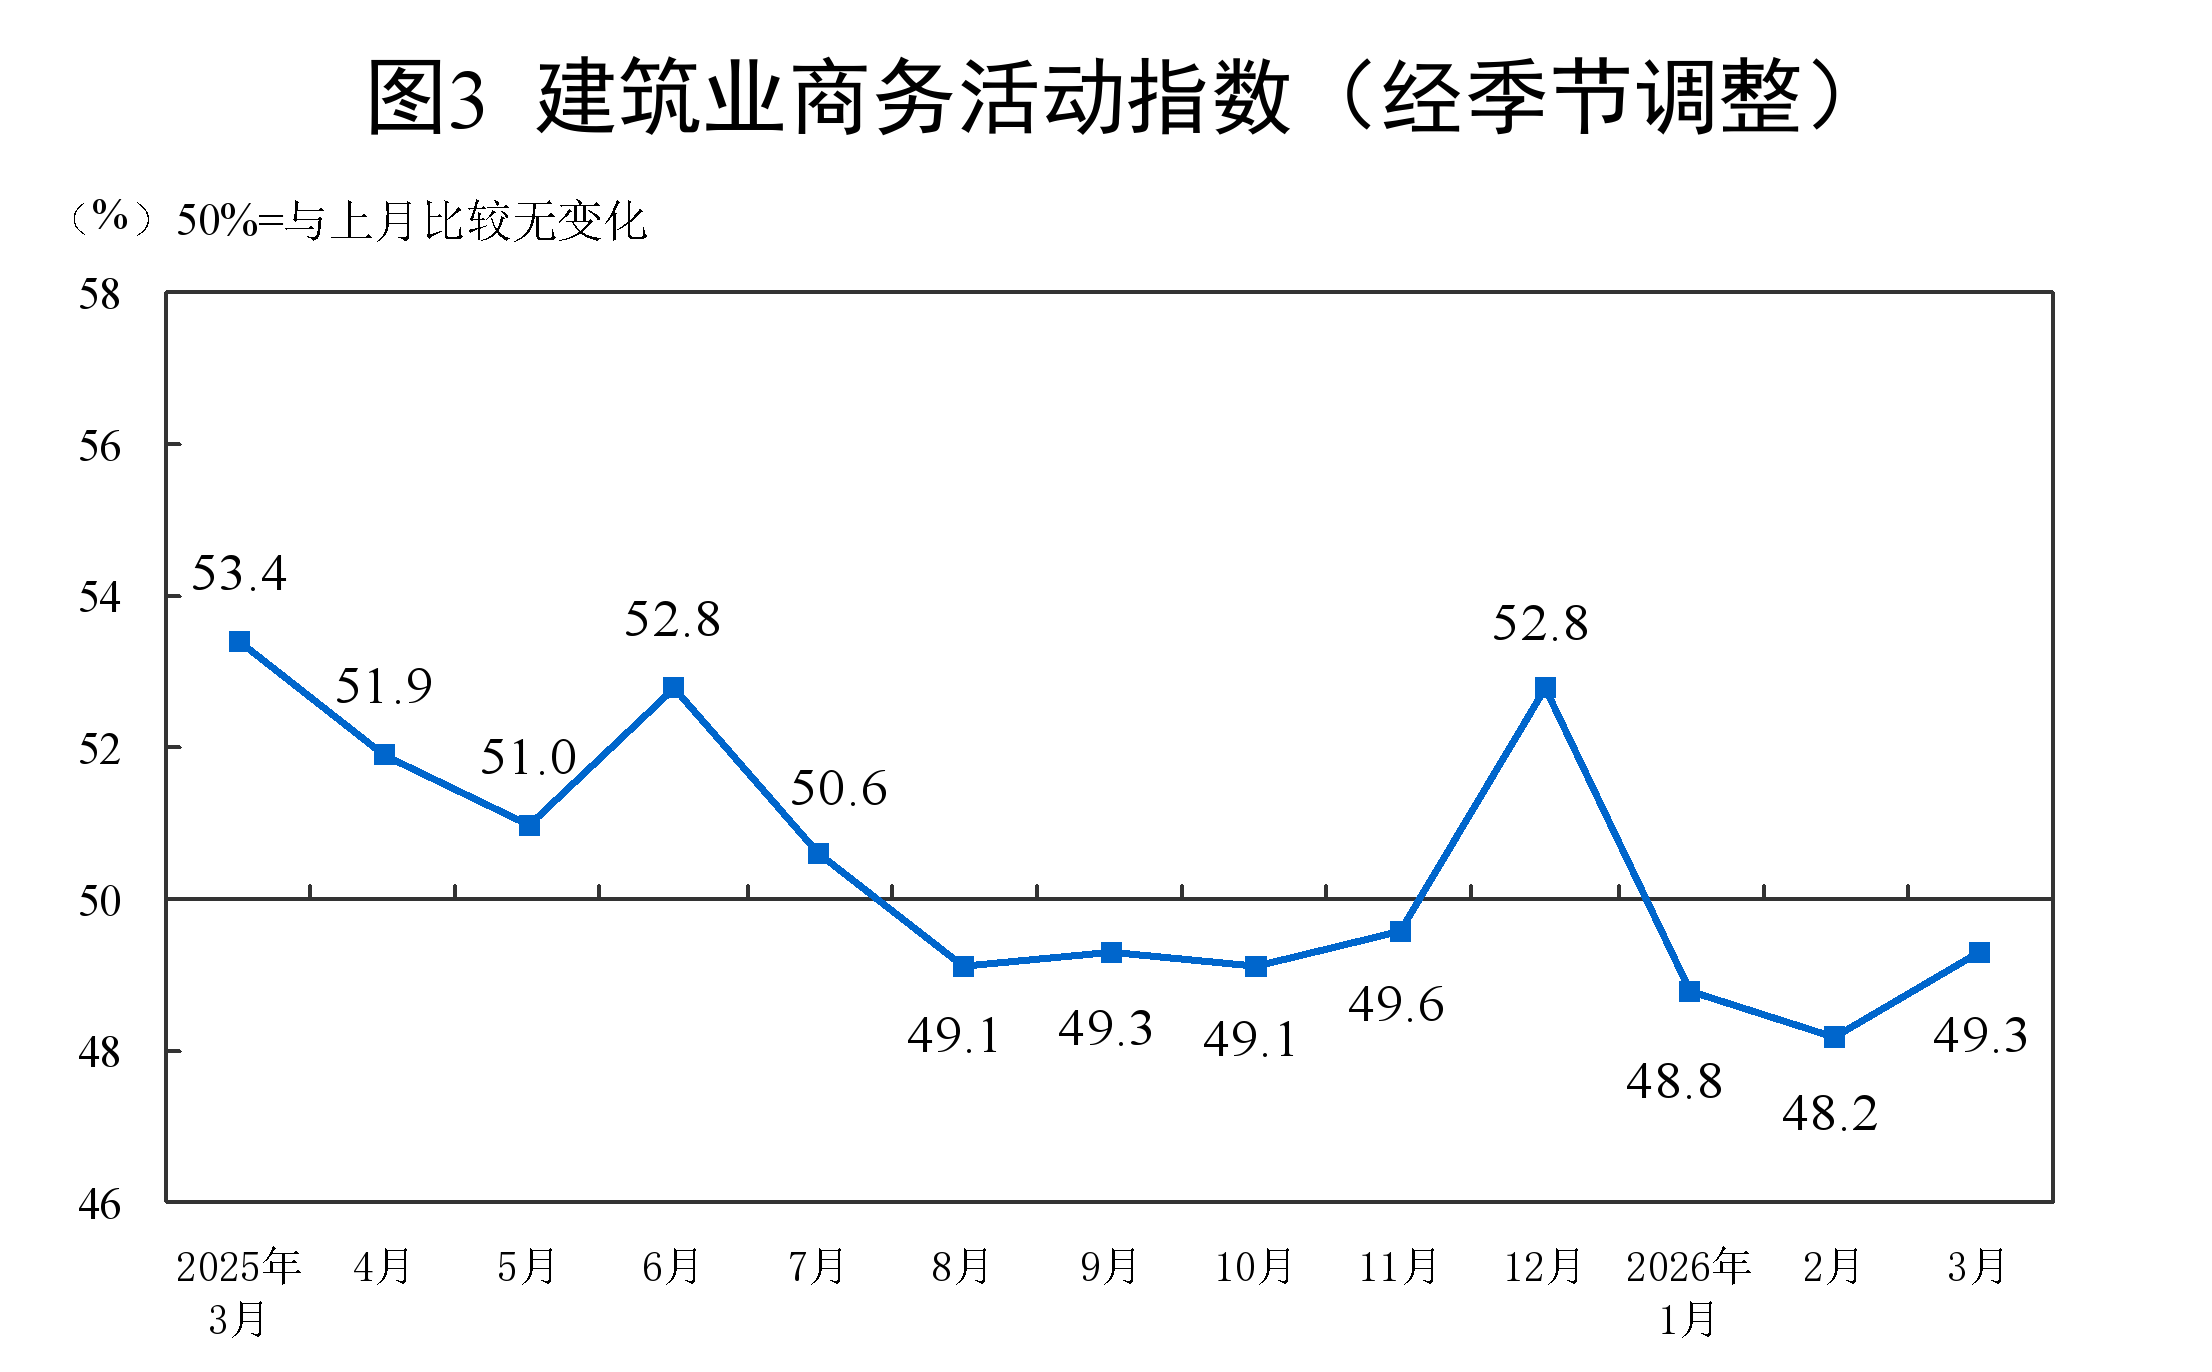
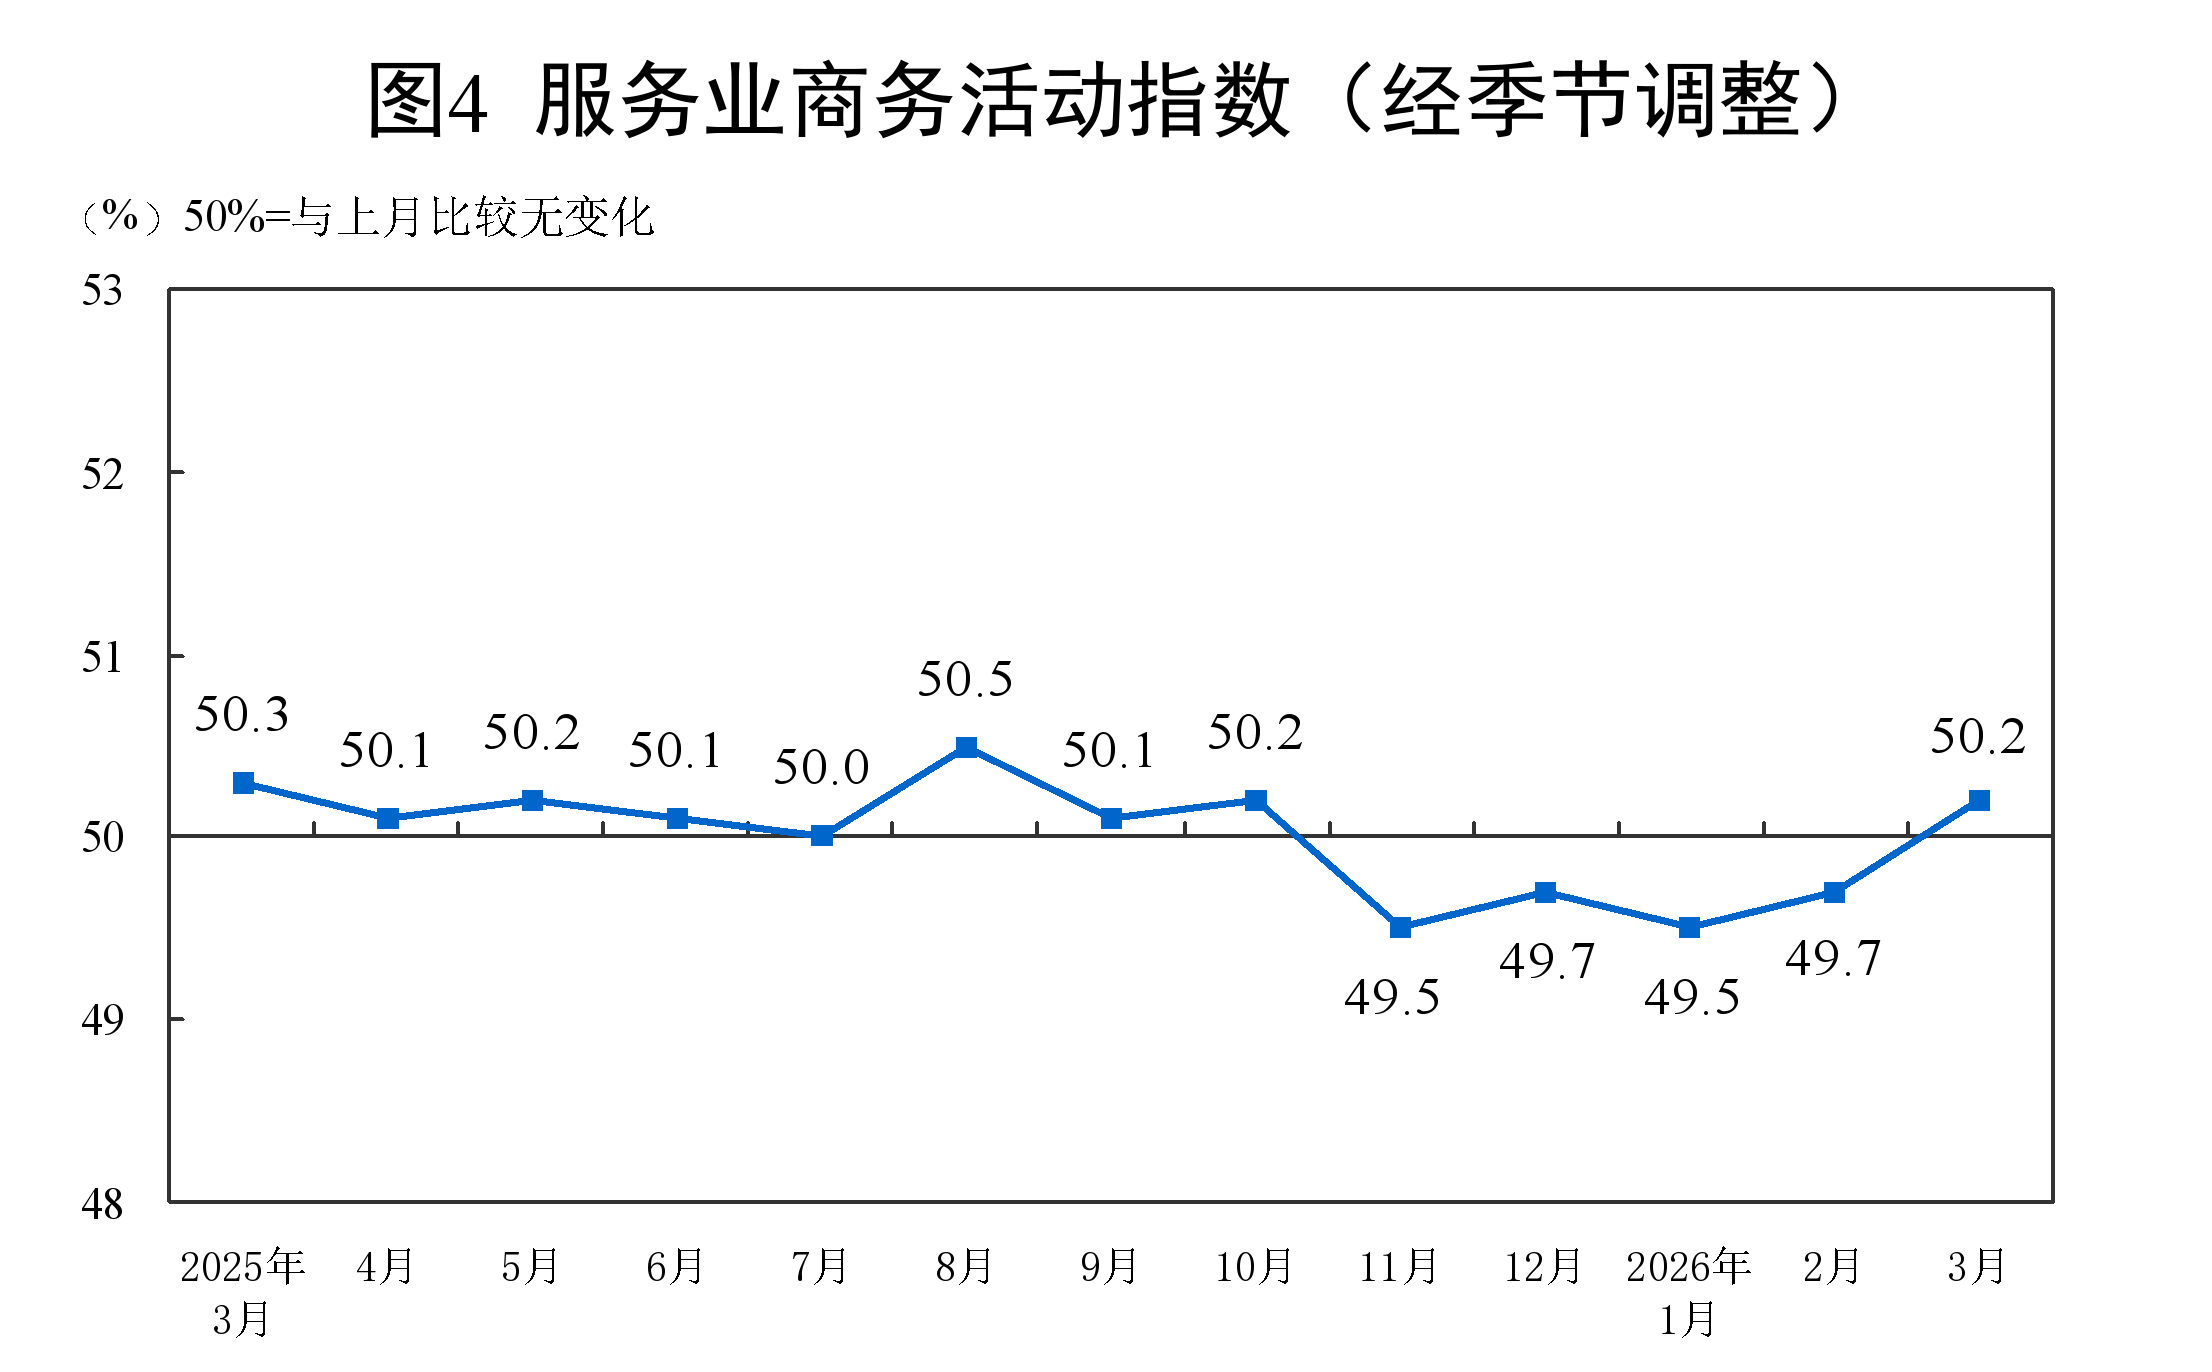
By industry, the business activity index of the construction sector was 49.3%, up 1.1 percentage points MoM; the business activity index of the services sector was 50.2%, up 0.5 percentage points MoM. From the perspective of the services sector, the business activity index for industries such as railway transportation, telecommunications, radio, television and satellite transmission services, monetary and financial services, and insurance all remained in the relatively high expansion territory above 55.0%; the business activity index for industries such as retail, accommodation, catering, and real estate all stayed below the critical point.
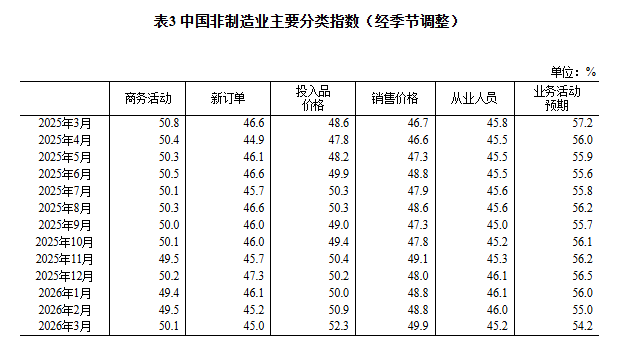
The new orders index was 45.0%, down 0.2 percentage points from the previous month, indicating that market demand in the non-manufacturing sector pulled back somewhat. By industry, the new orders index for construction was 43.5%, up 1.3 percentage points from the previous month; the new orders index for services was 45.3%, down 0.4 percentage points from the previous month.
The input price index was 52.3%, up 1.4 percentage points from the previous month, indicating that the overall price level of inputs used in the operating activities of non-manufacturing enterprises continued to rise. By industry, the input price index for construction was 52.7%, up 3.6 percentage points from the previous month; the input price index for services was 52.2%, up 1.0 percentage points from the previous month.
The selling price index was 49.9%, up 1.1 percentage points from the previous month, but still below the critical point, indicating that the decline in the overall selling price level in the non-manufacturing sector narrowed. By industry, the selling price index for construction was 49.3%, up 1.7 percentage points from the previous month; the selling price index for services was 50.0%, up 1.0 percentage points from the previous month.
The employment index was 45.2%, down 0.8 percentage points from the previous month, indicating that employment conditions among non-manufacturing enterprises pulled back. By industry, the employment index for construction was 39.1%, down 3.4 percentage points from the previous month; the employment index for services was 46.2%, down 0.4 percentage points from the previous month.
The business activity expectations index was 54.2%, down 0.8 percentage points from the previous month, but still above the critical point, indicating that non-manufacturing enterprises remained optimistic about market development. By industry, the business activity expectations index for construction was 50.5%, down 0.4 percentage points from the previous month; the business activity expectations index for services was 54.8%, down 1.0 percentage points from the previous month.
III. Performance of China’s Composite PMI Output Index
In March, the composite PMI output index was 50.5%, up 1.0 percentage points from the previous month and above the critical point, indicating that the overall business activity level of production and operations among enterprises in China improved.

China’s PMI Returned to Expansion Territory in March
— Huo Lihui, Chief Statistician of the Service Industry Survey Center of the National Bureau of Statistics, Interprets China’s PMI for March 2026
On March 31, 2026, the Service Industry Survey Center of the National Bureau of Statistics and the China Federation of Logistics and Purchasing released China’s PMI. In this regard, Huo Lihui, Chief Statistician of the Service Survey Center of the National Bureau of Statistics, provided an interpretation.
In March, the manufacturing PMI, the non-manufacturing business activity index, and the composite PMI output index all returned to expansion territory, coming in at 50.4%, 50.1%, and 50.5%, respectively, up 1.4, 0.6, and 1.0 percentage points from the previous month, indicating a rebound in the overall economic prosperity level in China.
I. The Manufacturing PMI Rose to Expansion Territory
In March, as enterprises accelerated the resumption of work and production after the Chinese New Year and market activity increased, the manufacturing PMI came in at 50.4%, returning to expansion territory.
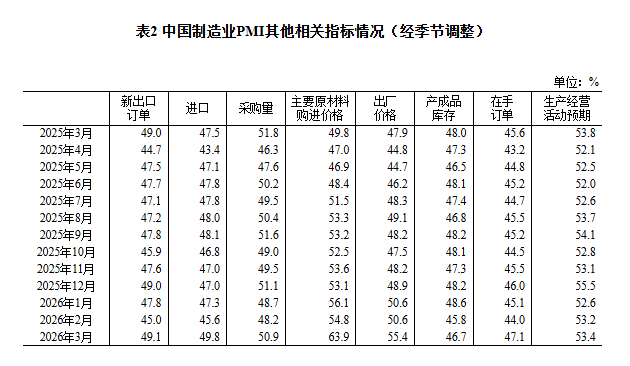
(I) Production and demand expanded simultaneously. The production index and the new orders index stood at 51.4% and 51.6%, respectively, up 1.8 and 3.0 percentage points from the previous month, and both rose into expansion territory. Manufacturing enterprises stepped up production activities, and market demand improved markedly. By industry, the production index and new orders index for such industries as agricultural and sideline food processing, non-ferrous metal smelting and rolling processing were both above 55.0%, and production and demand in related enterprises were released relatively quickly; the two indices for such industries as textile and apparel, chemical fibers, and rubber and plastic products remained below the critical point, with relatively weak market activity. Driven by the recovery in production and demand, enterprises’ purchase willingness strengthened, and the purchasing volume index was 50.9%, up 2.7 percentage points from the previous month.
(II) The PMI of large, medium-sized, and small enterprises all rebounded. The PMI of large enterprises was 51.6%, up 0.1 percentage points from the previous month, with the prosperity level rising steadily; the PMI of medium-sized and small enterprises was 49.0% and 49.3%, respectively, up 1.5 and 4.5 percentage points from the previous month, with the prosperity level improving significantly.
(III) The three key industries expanded relatively quickly. The PMI of high-tech manufacturing was 52.1%, up 0.6 percentage points from the previous month, and remained above the critical point for 14 consecutive months, indicating continued positive development momentum in the industry; the PMI of equipment manufacturing and the consumer goods industry was 51.5% and 50.8%, respectively, up 1.7 and 2.0 percentage points from the previous month, and both rose to expansion territory; the PMI of high energy-consuming industries was 48.9%, up 1.1 percentage points from the previous month, with the prosperity level showing some rebound.
(IV) Price indices rebounded significantly. Affected by factors such as the continued rise in prices of some bulk commodities in the recent period and the acceleration of enterprise procurement activities, the purchase price index of major raw materials and the ex-factory price index stood at 63.9% and 55.4%, respectively, up 9.1 and 4.8 percentage points from the previous month, and the overall price level in the manufacturing market rebounded markedly. By industry, the two price indices for such industries as petroleum, coal and other fuel processing, and chemical raw materials and chemical products were both above 70.0%, and the overall level of purchase and sales prices in related industries rose significantly.
(5) Market expectations remained stable with a slight increase. The index of expectations for production and business activities was 53.4%, up 0.2 percentage points MoM, indicating that manufacturing enterprises became somewhat more confident about near-term market developments. By industry, the index of expectations for production and business activities in sectors such as special-purpose equipment, automobiles, railway, shipbuilding, aerospace equipment, and other industries remained in a relatively high expansion range above 56.0%, and the related enterprises were more optimistic about future industry development.
The survey results also showed that, affected by factors such as the current geopolitical conflicts in the Middle East, prices of related raw materials such as petroleum and chemicals rose sharply. Coupled with higher logistics freight rates, the proportion of enterprises reporting high raw material costs and high logistics costs both increased MoM this month.
II. The Non-Manufacturing Business Activity Index Rebounded
In March, the non-manufacturing business activity index was 50.1%, up 0.6 percentage points MoM, indicating an improvement in the prosperity level of the non-manufacturing sector.
(1) The service sector business activity index rose above the threshold. The service sector business activity index was 50.2%, up 0.5 percentage points MoM. By industry, the business activity indexes for railway transportation, telecommunications, broadcasting, television and satellite transmission services, monetary and financial services, and insurance all remained in a relatively high expansion range above 55.0%, with total business volume growing relatively fast; after Chinese New Year, the business activity indexes for retail, accommodation, catering, and other industries related to residents' travel and consumption fell below the threshold, and market activity weakened somewhat. In terms of market expectations, the service sector business activity expectations index was 54.8%, continuing to remain at a relatively high level, indicating that service sector enterprises remained optimistic about near-term market developments.
(2) The construction sector business activity index improved. As construction projects across various regions gradually resumed work after the holiday, the construction sector business activity index was 49.3%, up 1.1 percentage points MoM. In terms of market expectations, the construction sector business activity expectations index was 50.5%, above the threshold, indicating that construction enterprises remained confident about future industry development.
III. The Composite PMI Output Index Rose Above the Threshold
In March, the composite PMI output index was 50.5%, up 1.0 percentage points MoM, indicating that the overall level of production and business activity across China's enterprises continued to improve. The manufacturing production index and the non-manufacturing business activity index, which together constitute the composite PMI output index, were 51.4% and 50.1%, respectively.
![Metals Showed Mixed Performance, with Lithium Carbonate and SHFE Aluminum Leading the Declines, Polysilicon Falling More Than 5%, and Stainless Steel Rising Nearly 3% [SMM Midday Review]](https://imgqn.smm.cn/usercenter/obeMy20251217171735.jpg)
![Downstream restocking and cargo pick-up, market supply decreases [SMM North China Spot Copper]](https://imgqn.smm.cn/usercenter/arNnt20251217171714.jpeg)
![The most-traded SHFE tin contract fluctuates at highs, and the spot trading sentiment further weakens [SMM Tin Midday Review]](https://imgqn.smm.cn/usercenter/nyMyJ20251217171751.jpg)