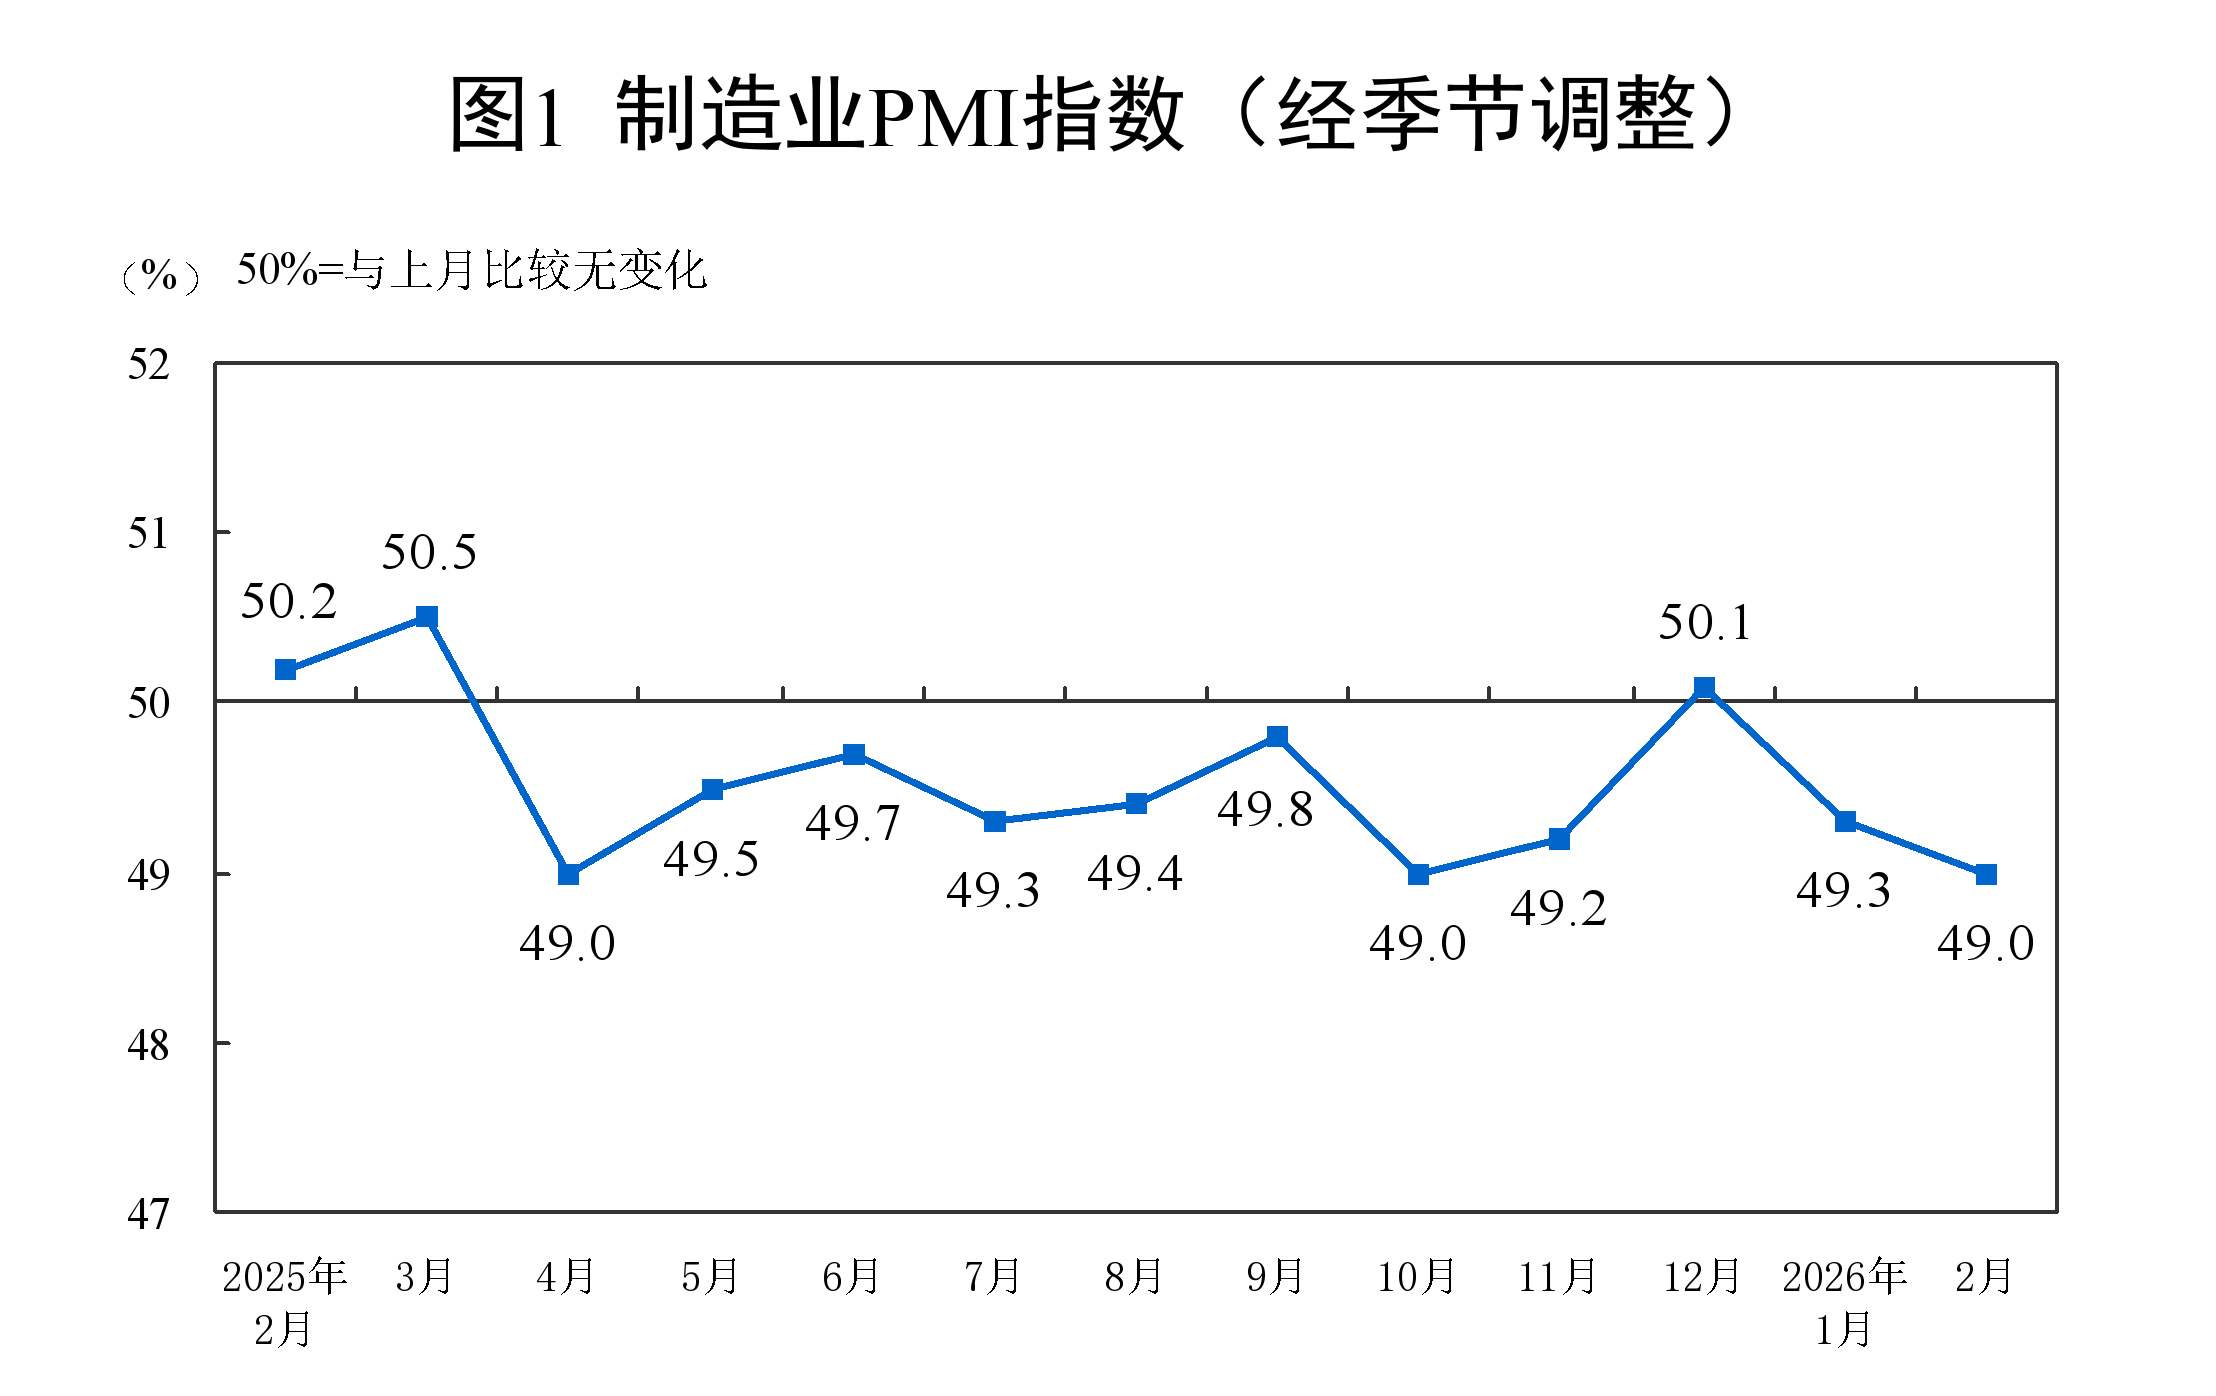
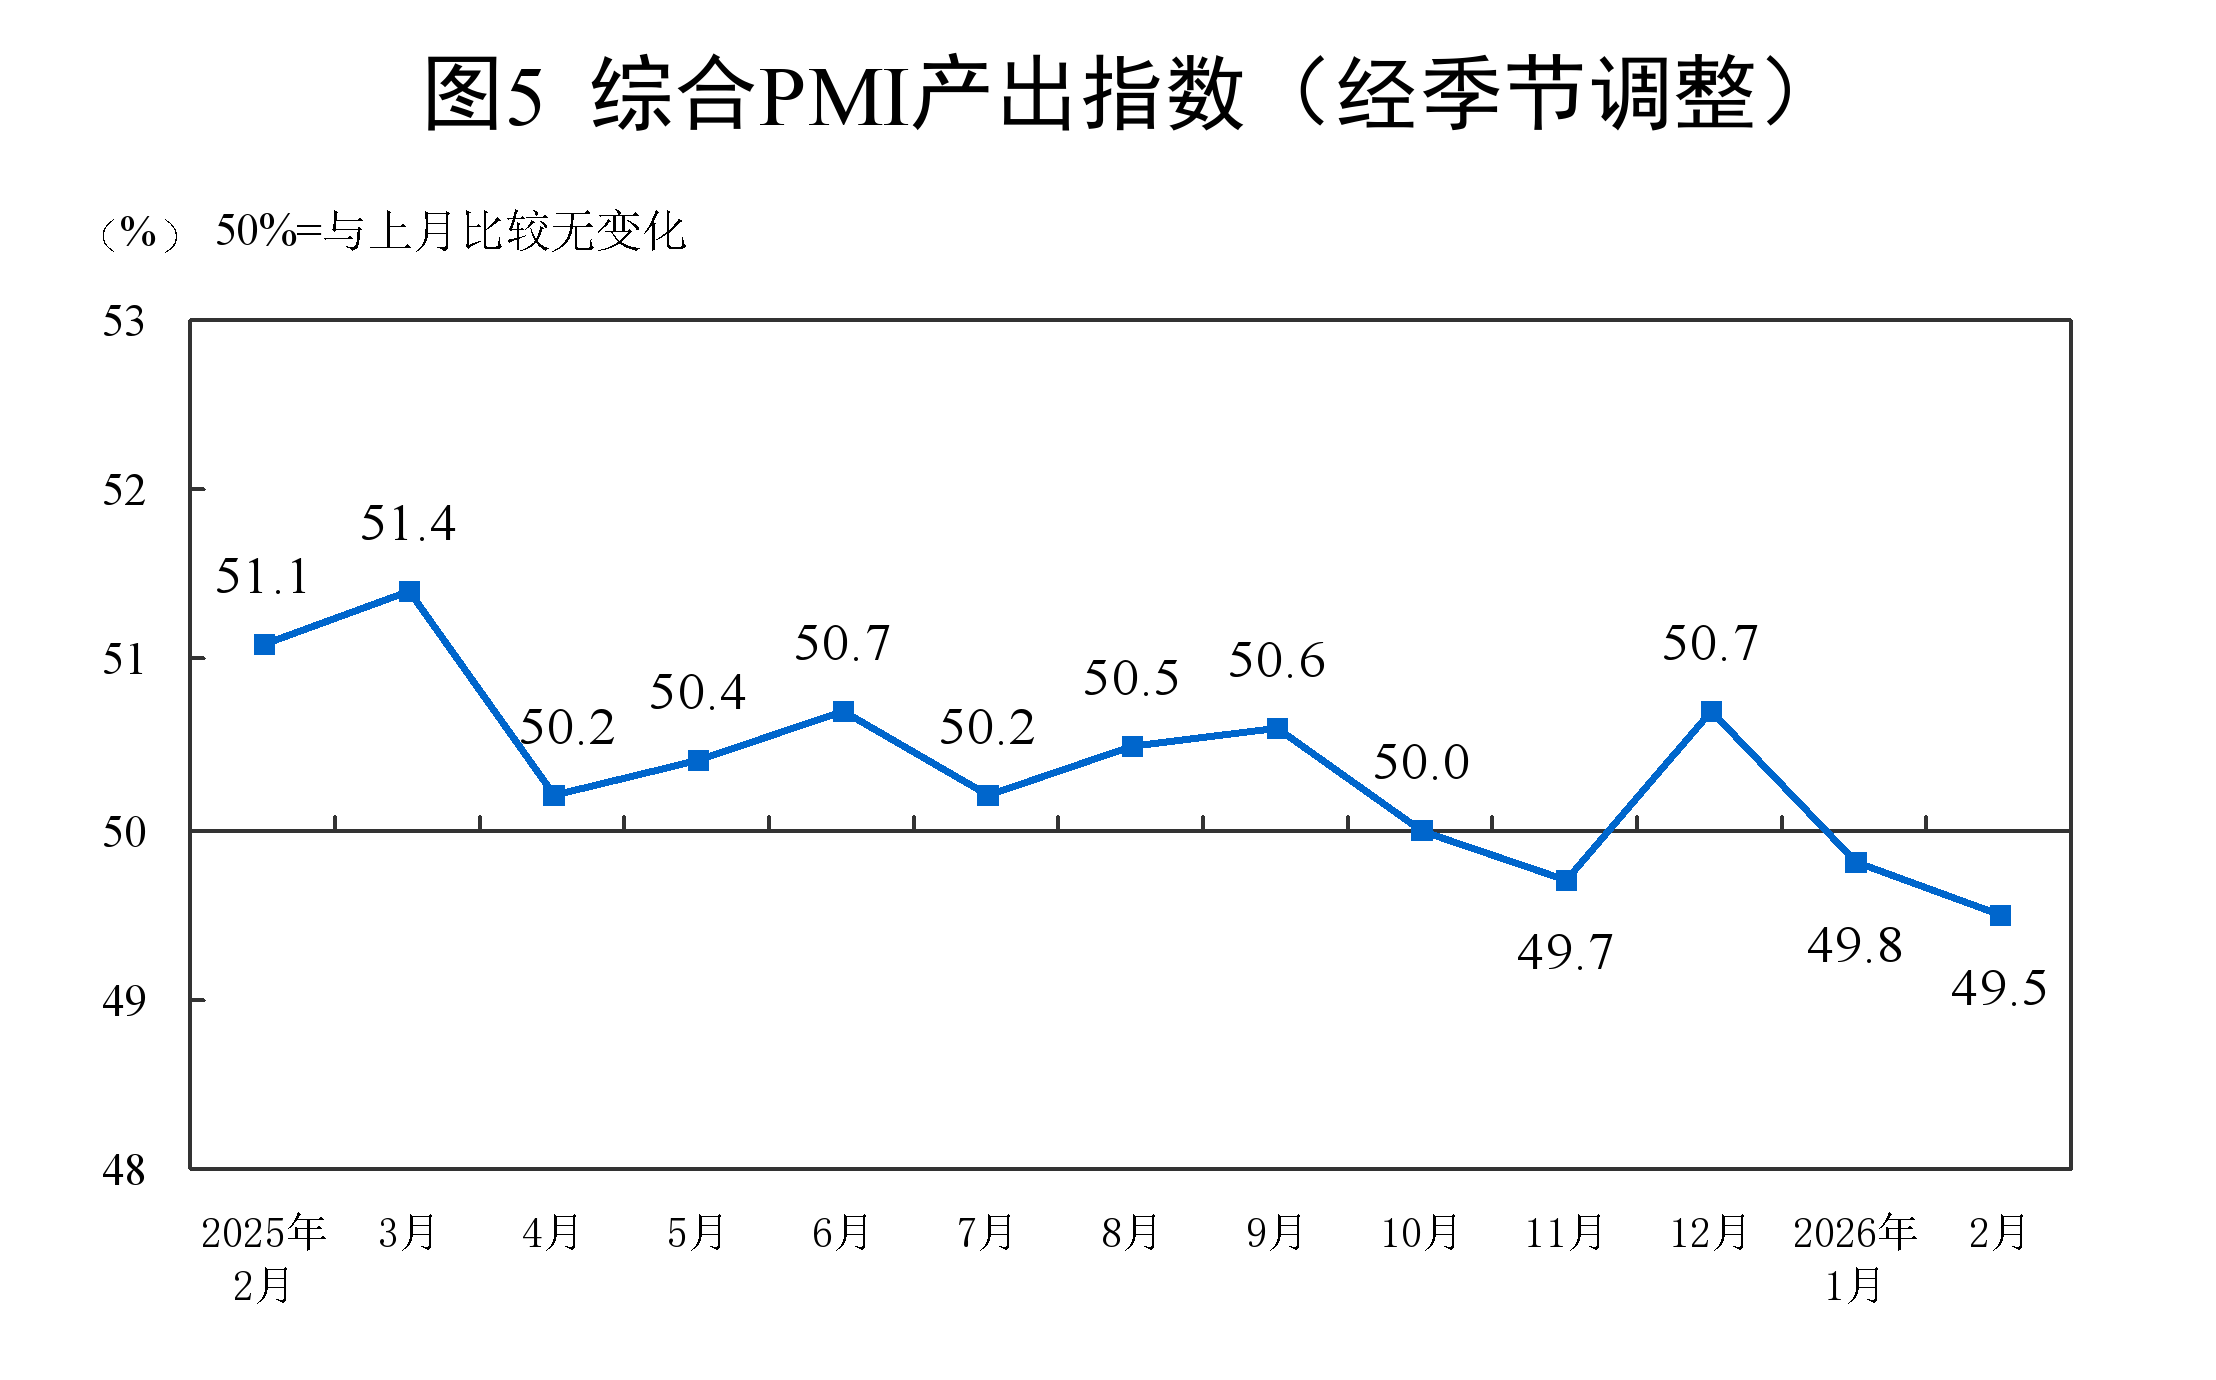
NBS data showed that in February, the manufacturing PMI was 49.0%, down 0.3 percentage points from the previous month, indicating a pullback in the manufacturing sector’s prosperity level. In February, the non-manufacturing business activity index was 49.5%, up 0.1 percentage points from the previous month, indicating an improvement in the non-manufacturing sector’s prosperity level. In February, the composite PMI output index was 49.5%, down 0.3 percentage points from the previous month, indicating that overall production and business activities of enterprises in China slowed down from the previous month.
Huo Lihui, Chief Statistician of the NBS Service Sector Survey Center, interpreted China’s PMI for February 2026.
Performance of China’s PMI in February 2026
I. Performance of China’s Manufacturing PMI
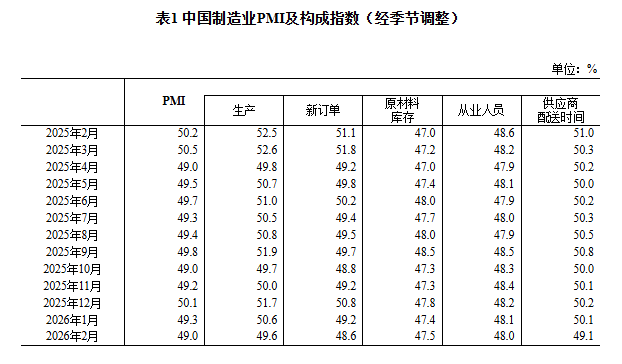
In February, the manufacturing PMI was 49.0%, down 0.3 percentage points from the previous month, indicating a pullback in the manufacturing sector’s prosperity level.
By enterprise size, the PMI for large enterprises was 51.5%, up 1.2 percentage points from the previous month and above the threshold; the PMIs for medium- and small-sized enterprises were 47.5% and 44.8%, down 1.2 and 2.6 percentage points from the previous month, respectively, and below the threshold.
By sub-index, among the five sub-indices that make up the manufacturing PMI, the production index, new orders index, raw material inventory index, employment index, and supplier delivery time index were all below the threshold.
The production index was 49.6%, down 1.0 percentage points from the previous month, indicating that manufacturing production activities slowed down.
The new orders index was 48.6%, down 0.6 percentage points from the previous month, indicating a decline in the prosperity of market demand in the manufacturing sector.
The raw material inventory index was 47.5%, up 0.1 percentage points from the previous month, indicating that the decline in inventories of major raw materials in the manufacturing sector narrowed slightly.
The employment index was 48.0%, down 0.1 percentage points from the previous month, indicating a slight pullback in the employment prosperity of manufacturing enterprises.
The supplier delivery time index was 49.1%, down 1.0 percentage points from the previous month, indicating that delivery times of raw material suppliers in the manufacturing sector slowed compared with the previous month.
II. Performance of China’s Non-Manufacturing PMI
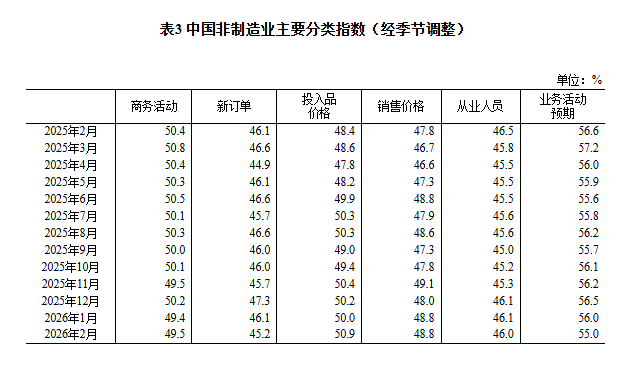
In February, the non-manufacturing business activity index was 49.5%, up 0.1 percentage points from the previous month, indicating an improvement in the non-manufacturing sector’s prosperity level.
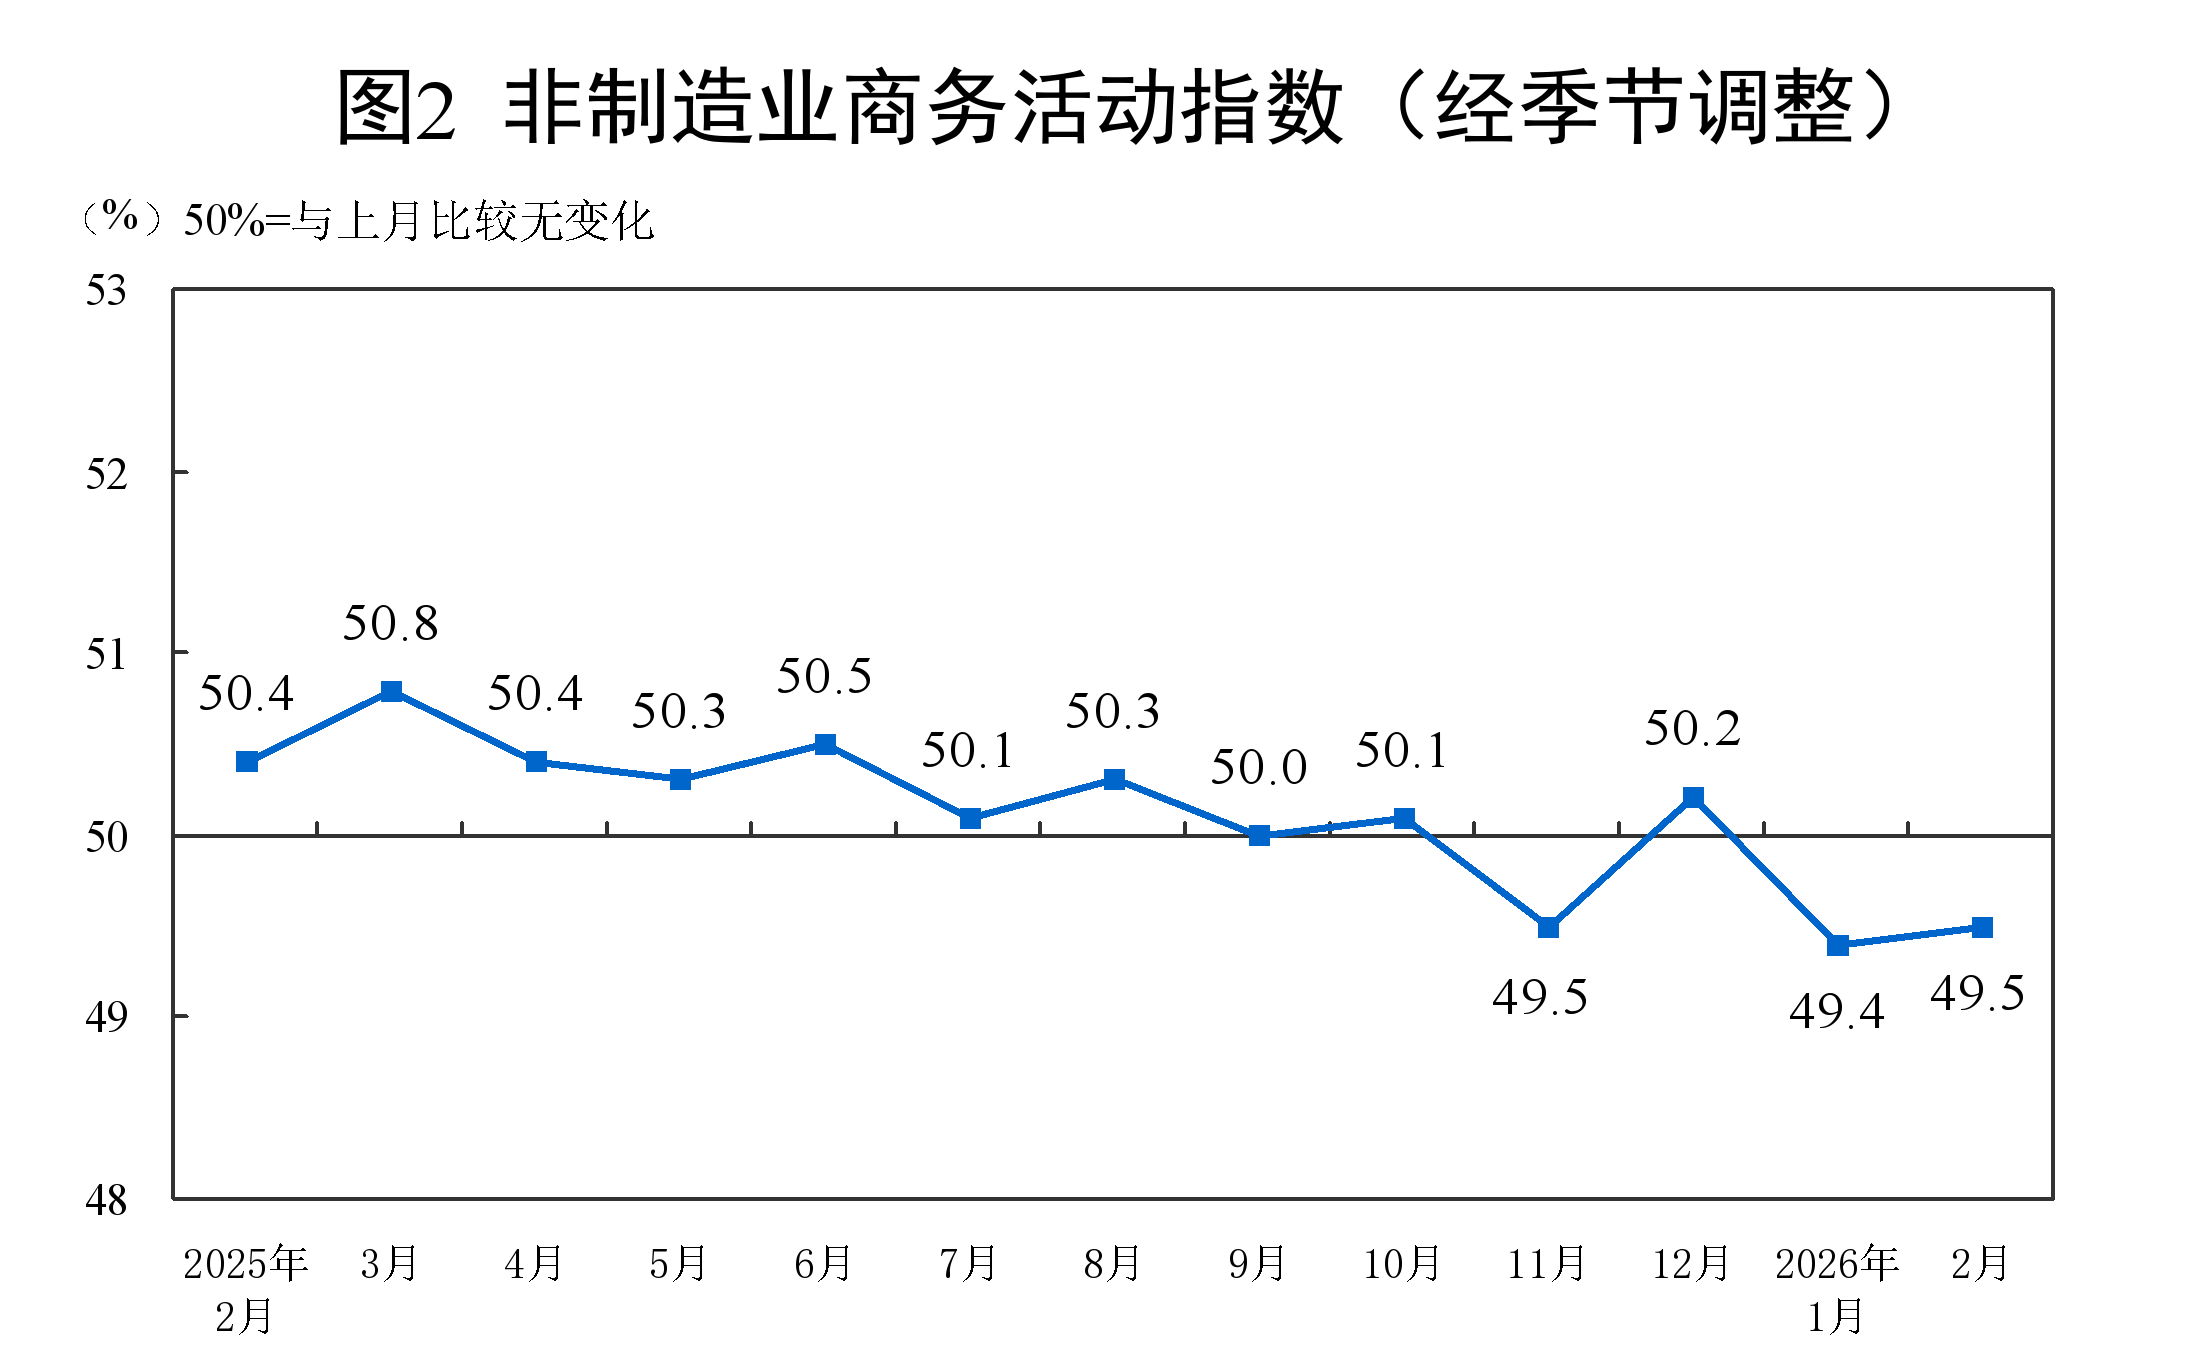
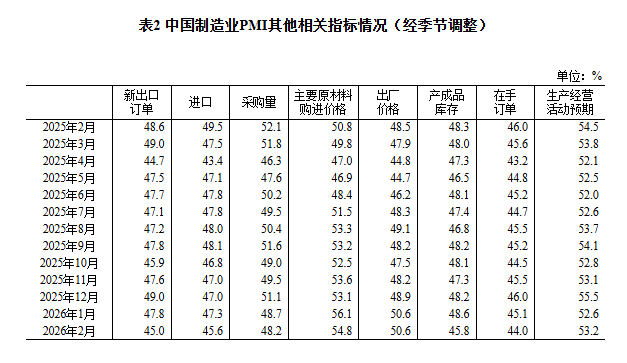
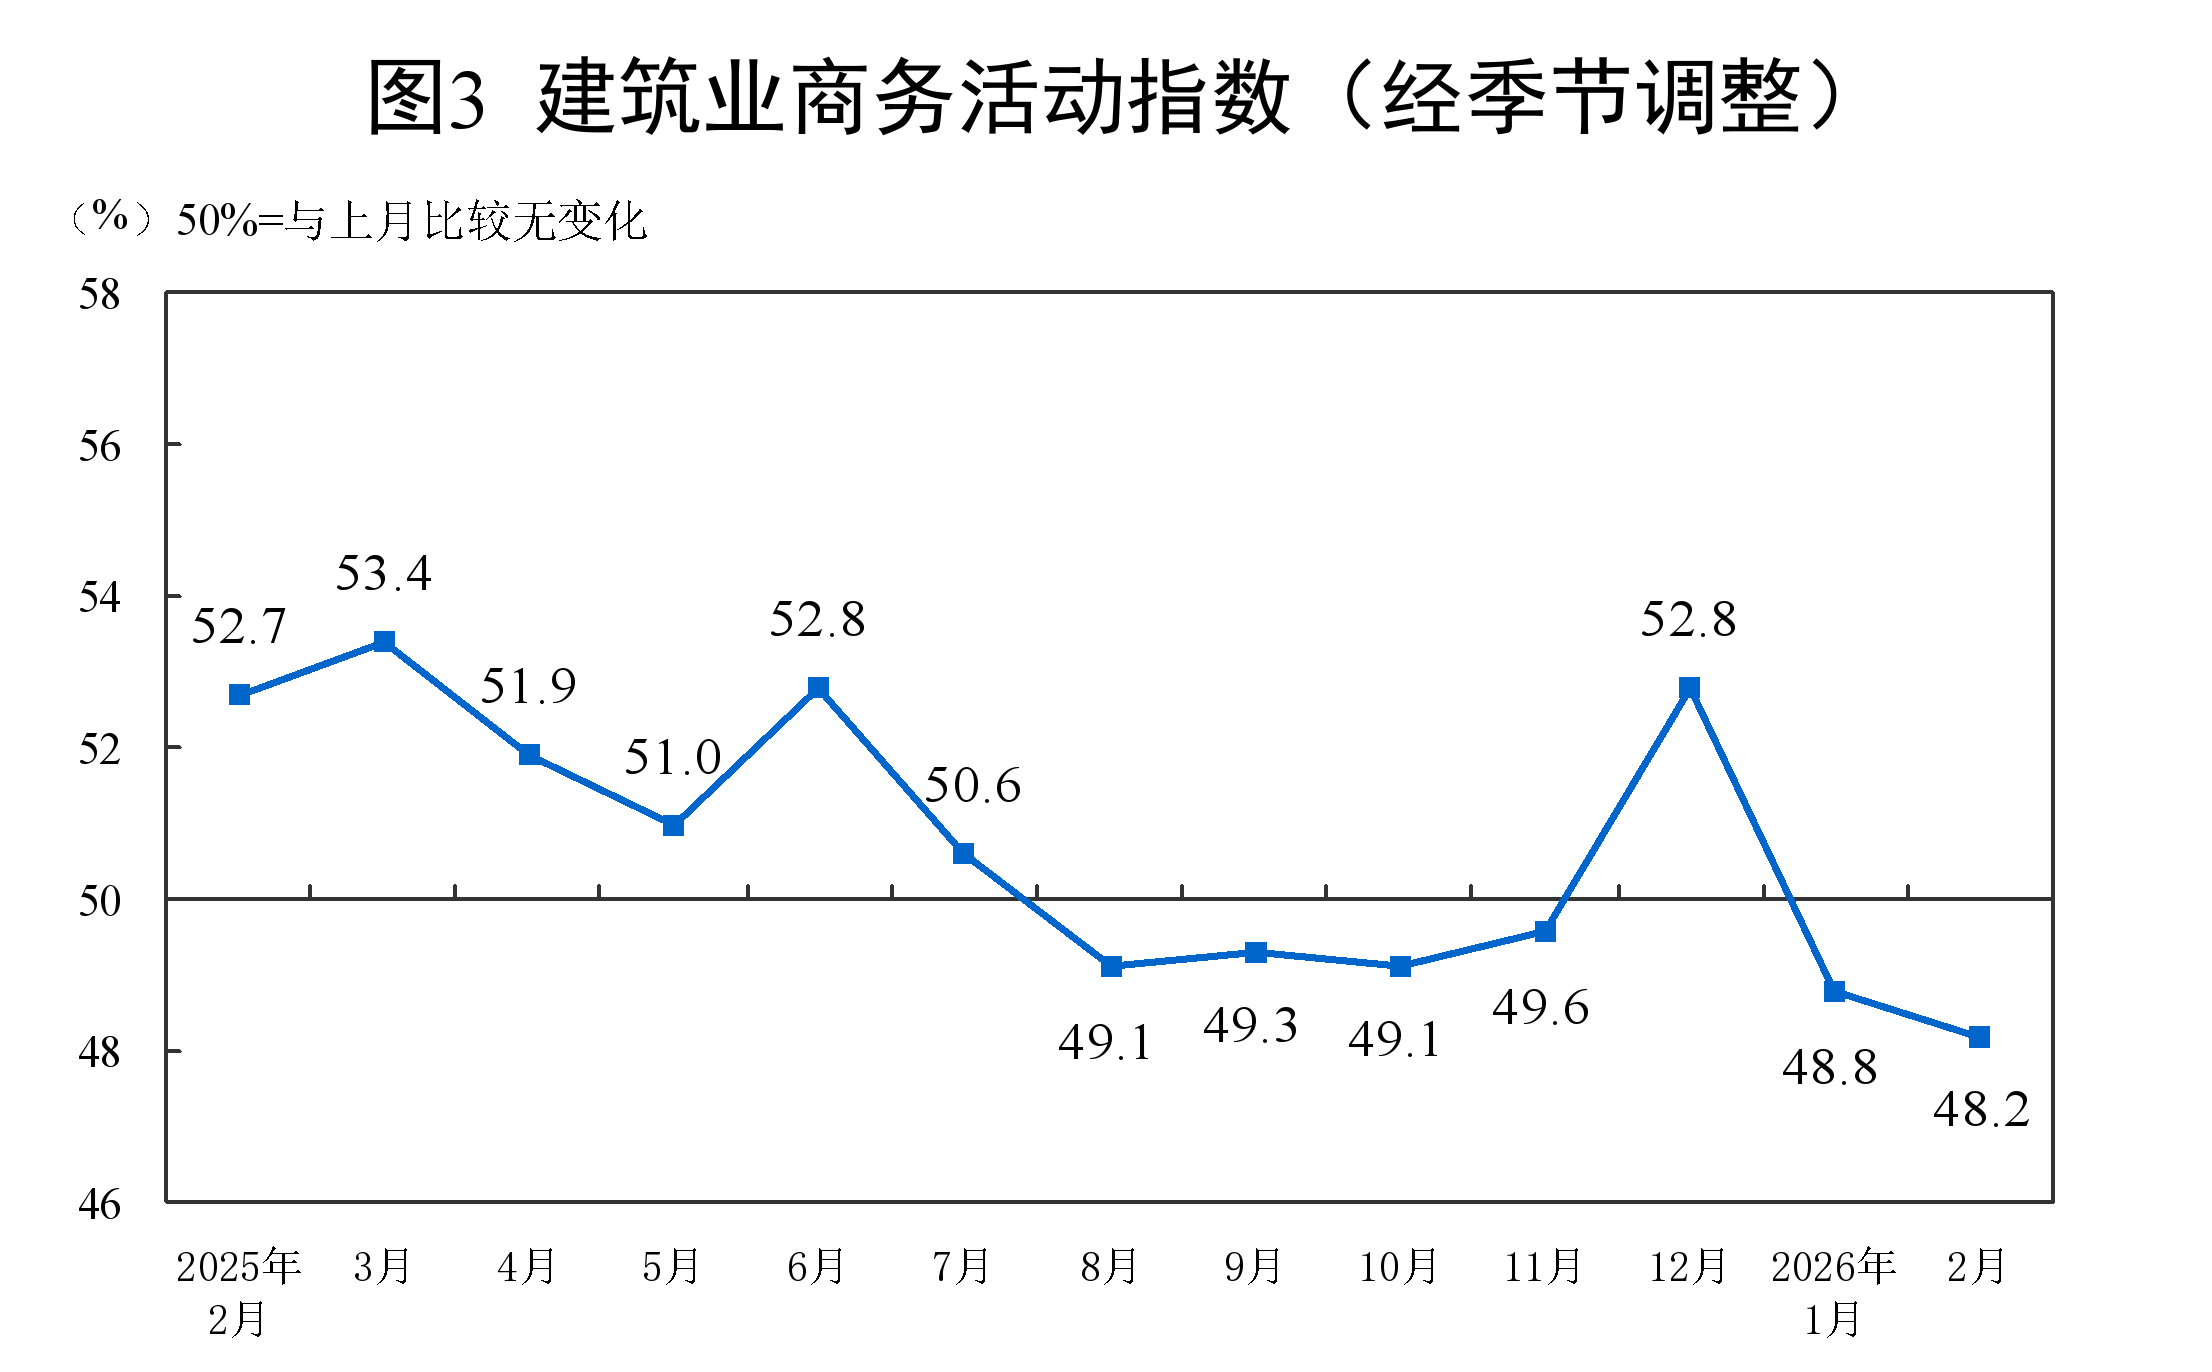
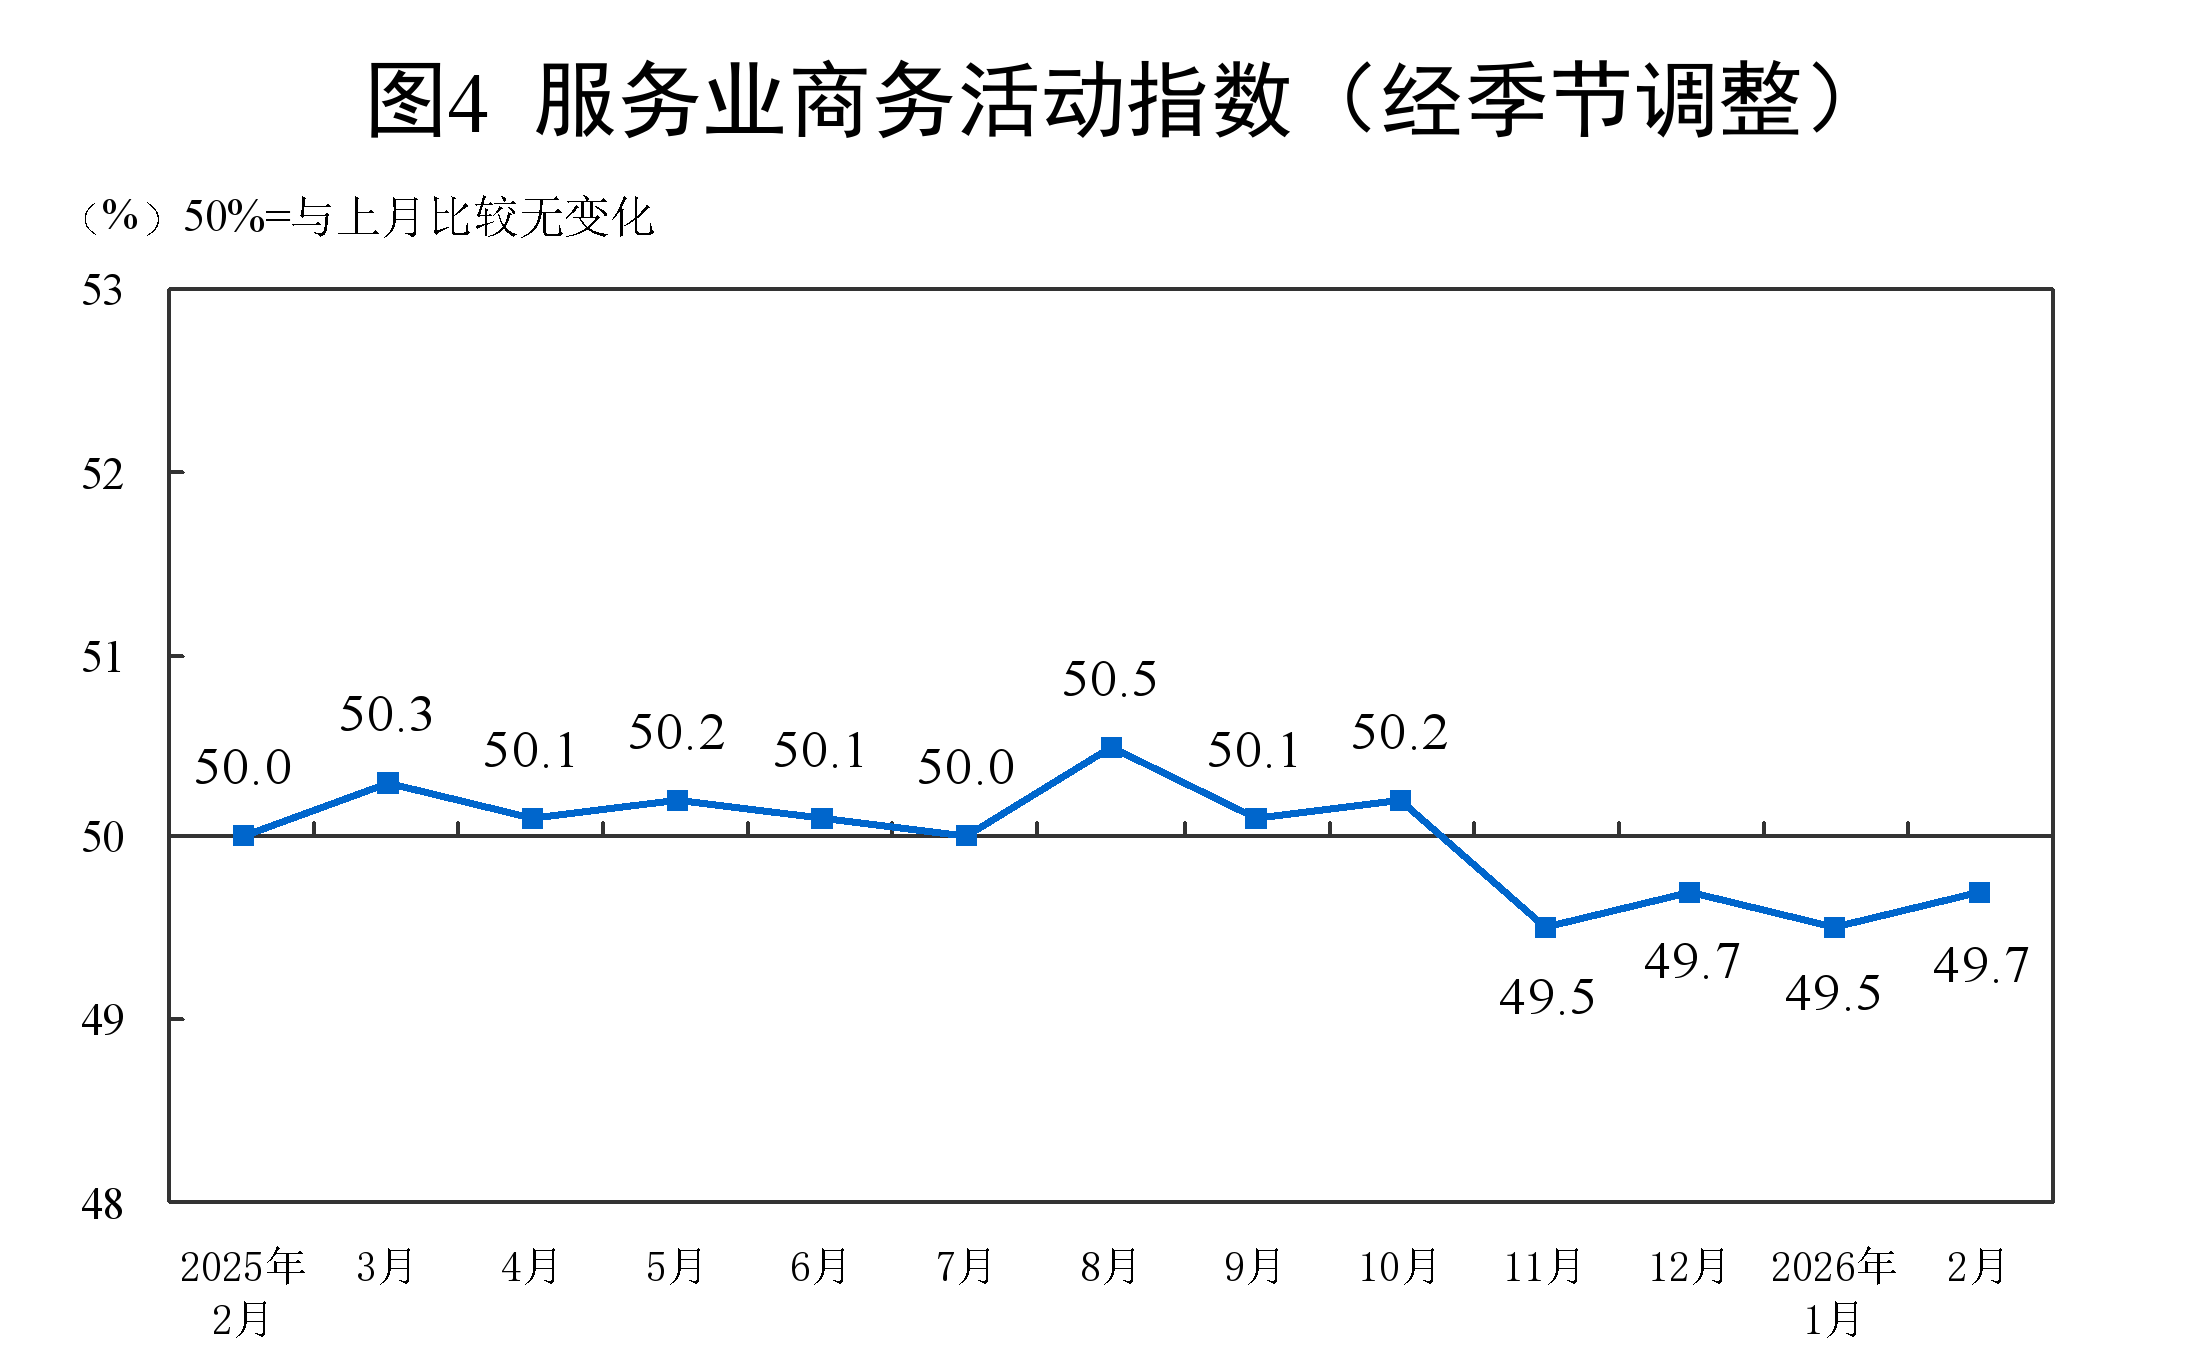
By industry, the construction business activity index was 48.2%, down 0.6 percentage points from the previous month; the services business activity index was 49.7%, up 0.2 percentage points from the previous month. From the perspective of service industries, the business activity indices for industries such as accommodation, catering, and culture/sports/entertainment were all in a high prosperity range above 60.0%; the business activity indices for industries such as capital market services and real estate were all below the threshold.
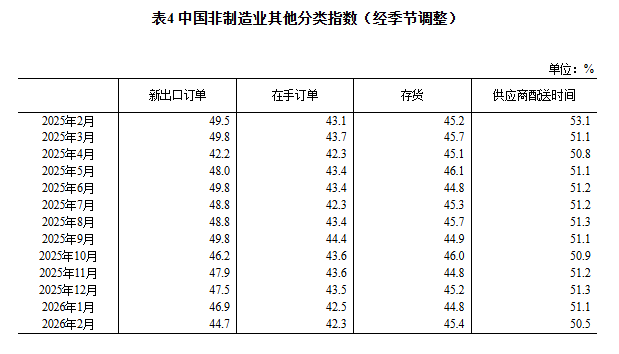
The new orders index was 45.2%, down 0.9 percentage points MoM, indicating a pull back in non-manufacturing market demand. By industry, the new orders index for the construction industry was 42.2%, up 2.1 percentage points MoM; the new orders index for the services industry was 45.7%, down 1.4 percentage points MoM.
The input prices index was 50.9%, up 0.9 percentage points MoM, indicating an overall increase in the price level of inputs used by non-manufacturing enterprises for business operations. By industry, the input prices index for the construction industry was 49.1%, down 2.9 percentage points MoM; the input prices index for the services industry was 51.2%, up 1.5 percentage points MoM.
The selling price index was 48.8%, unchanged from the previous month and still below the threshold, indicating that the overall level of non-manufacturing selling prices was lower than in the previous month. By industry, the selling price index for the construction industry was 47.6%, down 0.6 percentage points MoM; the selling price index for the services industry was 49.0%, up 0.1 percentage points MoM.
The employment index was 46.0%, down 0.1 percentage points MoM, indicating a slight pull back in the employment prosperity of non-manufacturing enterprises. By industry, the employment index for the construction industry was 42.5%, up 1.4 percentage points MoM; the employment index for the services industry was 46.6%, down 0.4 percentage points MoM.
The business activity expectations index was 55.0%, down 1.0 percentage point MoM and still in a relatively high prosperity range, indicating that non-manufacturing enterprises remained confident in market development. By industry, the business activity expectations index for the construction industry was 50.9%, up 1.1 percentage points MoM; the business activity expectations index for the services industry was 55.8%, down 1.3 percentage points MoM.
III. Performance of China’s Composite PMI Output Index
In February, the composite PMI output index was 49.5%, down 0.3 percentage points MoM, indicating that overall production and business activities of enterprises in China slowed down compared with the previous month.
In February, the manufacturing PMI pulled back, while the non-manufacturing business activity index rebounded slightly.
—Huo Lihui, Chief Statistician of the NBS Service Survey Center, interprets China’s PMI for February 2026
On March 4, 2026, the NBS Service Survey Center and the China Federation of Logistics and Purchasing released China’s PMI. In this regard, Huo Lihui, Chief Statistician of the Service Industry Survey Center of the National Bureau of Statistics (NBS), provided an interpretation.
In February, affected by factors such as the Chinese New Year holiday, the manufacturing PMI was 49.0, down 0.3 percentage points MoM; the non-manufacturing business activity index was 49.5, up 0.1 percentage points MoM; and the composite PMI output index was 49.5, down 0.3 percentage points MoM.
I. The Manufacturing PMI Pulled Back
In February, the manufacturing PMI was 49.0, with the prosperity level down from the previous month. Judging from historical data, the PMI in the month that includes the Chinese New Year mostly shows some fluctuations. In particular, this year’s Chinese New Year holiday was extended and fell entirely in mid-to-late February, which had some impact on enterprises’ production and operations, and overall market activity in manufacturing declined.
(1) Both supply and demand slowed down. The production index and the new orders index were 49.6 and 48.6, down 1.0 and 0.6 percentage points MoM, respectively, indicating a pullback in manufacturing production and market demand. By industry, the production index and new orders index for industries such as agricultural and sideline food processing and computers, communications and electronic equipment were both above the critical point, with supply and demand prosperity remaining in expansion; in industries such as textiles, apparel and accessories and automobiles, both indices remained below the critical point, with weak market activity.
(2) The PMI for large enterprises continued to expand. The PMI for large enterprises was 51.5, up 1.2 percentage points MoM, with production and operations remaining in expansion; small and medium-sized enterprises were more affected by the Chinese New Year holiday, with PMIs of 47.5 and 44.8 this month, down 1.2 and 2.6 percentage points MoM, respectively, and their prosperity levels pulled back.
(3) Growth momentum in high-tech manufacturing continued to emerge. The high-tech manufacturing PMI was 51.5, remaining in expansion territory and significantly higher than the overall manufacturing level, indicating a favorable development trend in related industries; the consumer goods industry PMI was 48.8, up 0.5 percentage points MoM, with a rebound in the prosperity level; the PMIs for equipment manufacturing and high energy-consuming industries were 49.8 and 47.8, down 0.3 and 0.1 percentage points MoM, respectively, with their prosperity levels pulling back.
(4) Enterprise expectations improved. The index of expectations for production and business activities was 53.2, up 0.6 percentage points MoM, indicating that manufacturing enterprises’ confidence in market development after the Chinese New Year strengthened. By industry, the index of expectations for production and business activities in industries such as general equipment and railway, ship, aerospace and aviation equipment was above 56.0, in a relatively high prosperity range, and related enterprises were more optimistic about near-term industry development.
II. Non-Manufacturing Business Activity Index Edged Up Slightly
In February, the non-manufacturing business activity index stood at 49.5%, up 0.1 percentage point from the previous month, indicating some improvement in the overall prosperity level of the non-manufacturing sector.
(I) The service sector’s prosperity level rebounded. The service sector business activity index was 49.7%, up 0.2 percentage point from the previous month. By industry, driven by the Chinese New Year holiday effect, business volumes grew relatively quickly in industries related to residents’ travel and consumption; among them, the business activity indices for accommodation, catering, and culture, sports and entertainment all remained in the high-prosperity range above 60.0%, while those for retail and air transport rose to above 52.0%. Meanwhile, the business activity indices for capital market services and real estate remained at low levels, with subdued market activity. From the perspective of market expectations, the service sector business activity expectations index was 55.8%, remaining in a relatively high-prosperity range, indicating that service sector enterprises remained optimistic about near-term market developments.
(II) The construction sector’s prosperity level declined. Affected by factors such as employees of enterprises returning to their hometowns in large numbers during the Chinese New Year holiday and the suspension of construction at some projects, the construction sector business activity index fell to 48.2%, down 0.6 percentage point from the previous month, and the construction sector’s prosperity level continued to pull back. From the perspective of market expectations, the construction sector business activity expectations index was 50.9%, up 1.1 percentage points from the previous month, returning above the threshold, indicating that construction sector enterprises’ confidence in future industry development had somewhat recovered.
III. Composite PMI Output Index Pulled Back
In February, the composite PMI output index was 49.5%, down 0.3 percentage point from the previous month, indicating that overall production and business activities of enterprises in China slowed down somewhat MoM. The manufacturing production index and the non-manufacturing business activity index, which make up the composite PMI output index, were 49.6% and 49.5%, respectively.
![East China Market Activity Declined, Central China Purchasing Sentiment Was Poor [SMM Spot Aluminum Midday Review]](https://imgqn.smm.cn/usercenter/XfCZS20251217171655.jpg)
![BC Copper Most-Traded Contract Closed Lower in Volatile Trading, Market Suppressed by Geopolitical and Supply-Demand Dual Pressures [SMM BC Copper Commentary]](https://imgqn.smm.cn/usercenter/udUol20251217171712.jpg)
![Early-Month Demand Recovery Failed to Overcome High-Price Suppression, Shanghai Spot Copper Premiums Rose Then Fell [SMM Shanghai Spot Copper]](https://imgqn.smm.cn/usercenter/HhNHP20251217171708.jpg)