As the aftermath of the trade war lingers, the import pattern of secondary copper in China is accelerating its restructuring [SMM Analysis]

Published: May 22, 2025 11:27

》View SMM copper quotes, data, and market analysis

》Click to view the historical price trend of SMM spot copper              

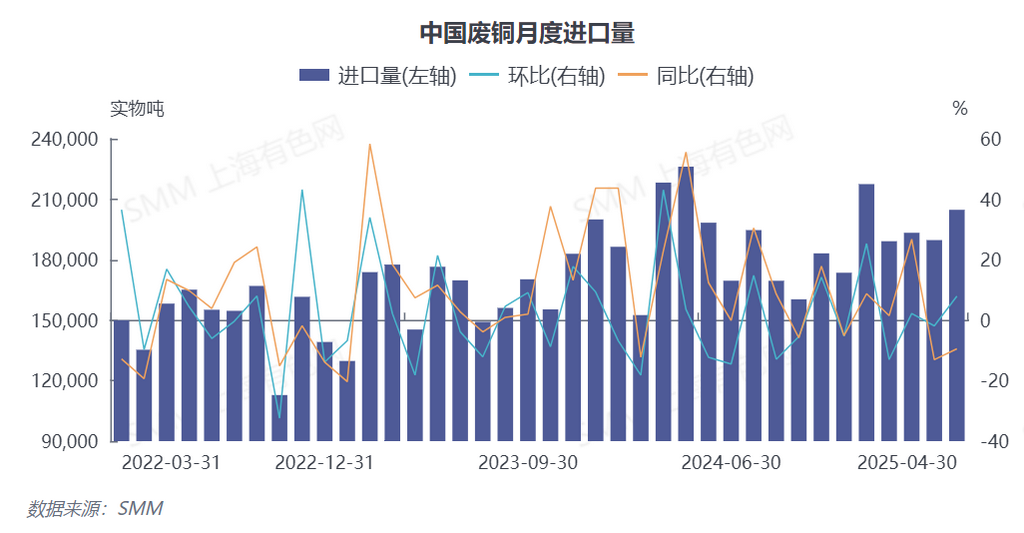
       The latest data from the General Administration of Customs (GAC) shows that in April 2025, China's imports of copper scrap and shredded copper scrap exhibited a trend of "MoM recovery but YoY contraction," with monthly imports reaching 204,700 mt, up 7.92% MoM but down 9.46% YoY. From January to April, cumulative imports totaled 777,000 mt, a slight decrease of 0.81% YoY (HS code 74040000).

       I. Drastic Changes in Regional Patterns: A "Three-Kingdom" Drama of the US, Japan, and Thailand


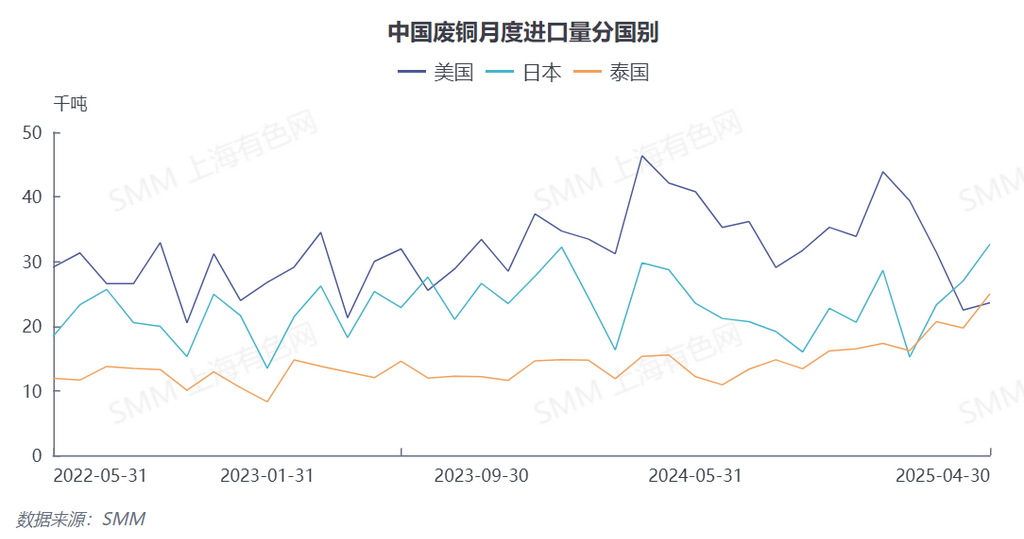
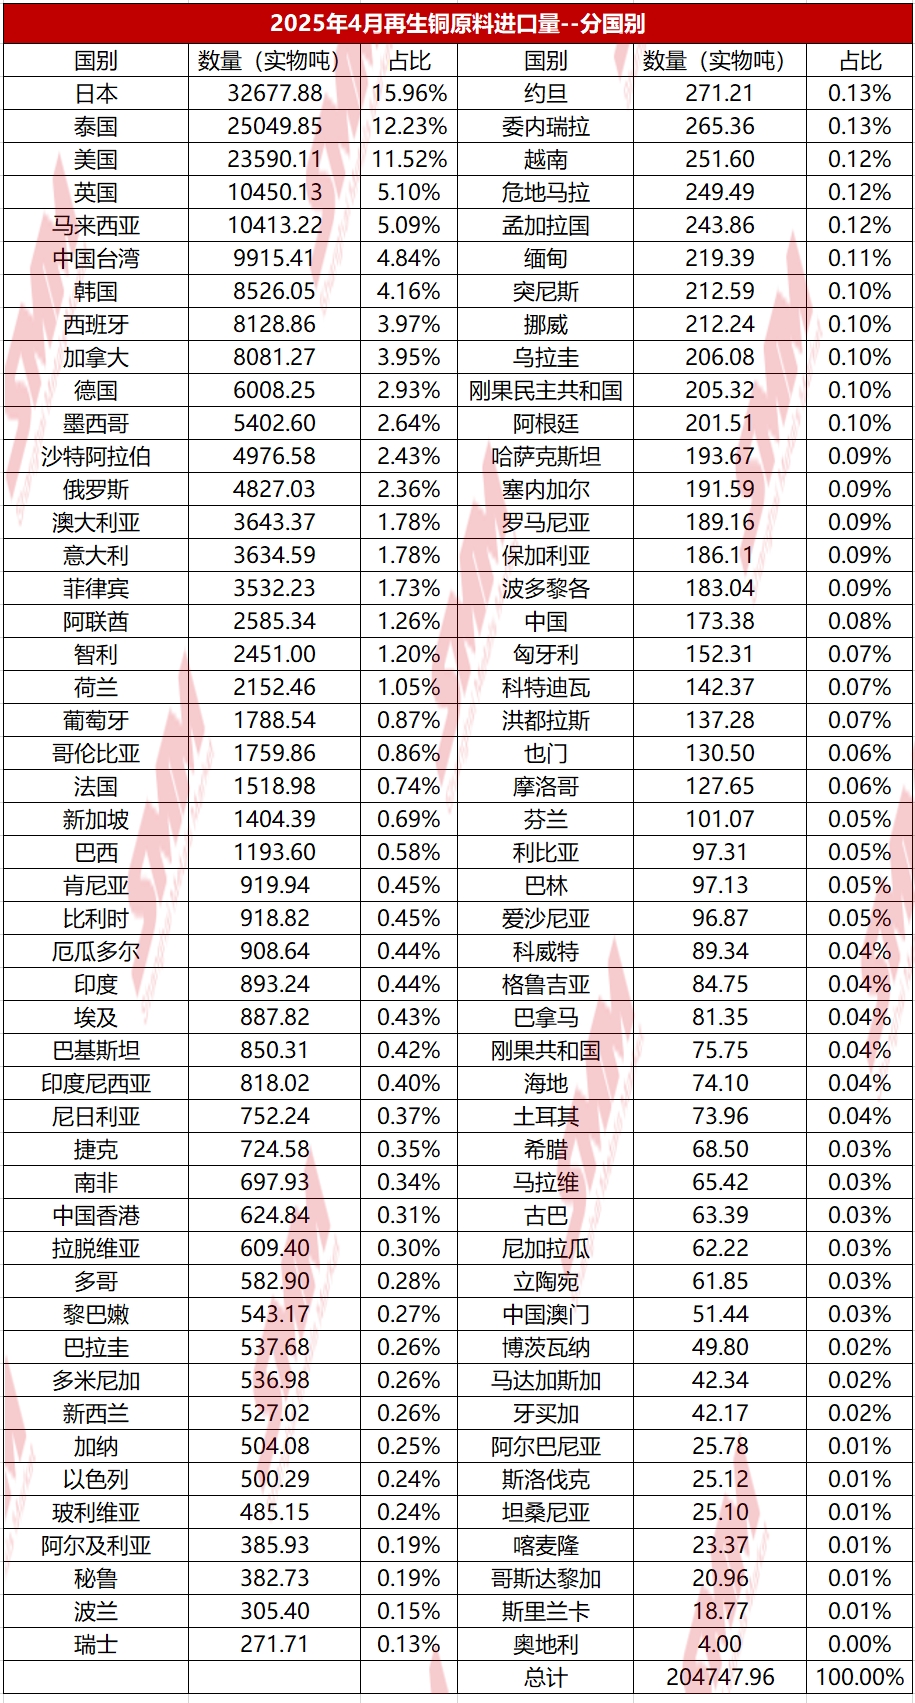
       Looking at the breakdown of import sources, there has been a significant shift in the current structure of import sources, with traditional dominant player, the US, continuing to cede market share. Data from March-April shows that US copper scrap exports to China exhibited characteristics of "double declines": in March, exports were 22,500 mt (down 28.41% MoM and 51.51% YoY), with its market share in China dropping to 11.85% and its ranking falling to second place; in April, although exports increased slightly by 4.98% MoM to 23,600 mt, they still fell sharply by 43.98% YoY, with its market share further shrinking to 11.52% and its ranking being overtaken by Thailand, falling to third place.

       In stark contrast is the strong rise of the Asian supply chain. Japan's exports to China reached 32,700 mt in April, up 21.02% MoM and 13.78% YoY against the trend, securing the top spot with a 15.96% share. Additionally, the Thai market saw exports of 25,000 mt that month, surging 26.9% MoM and 60.98% YoY, becoming the second-largest supplier. The synergy of the Asian regional supply chain is becoming increasingly prominent.


       II. Aggravation of Structural Shortages, Dual Pressures from Policy and Market

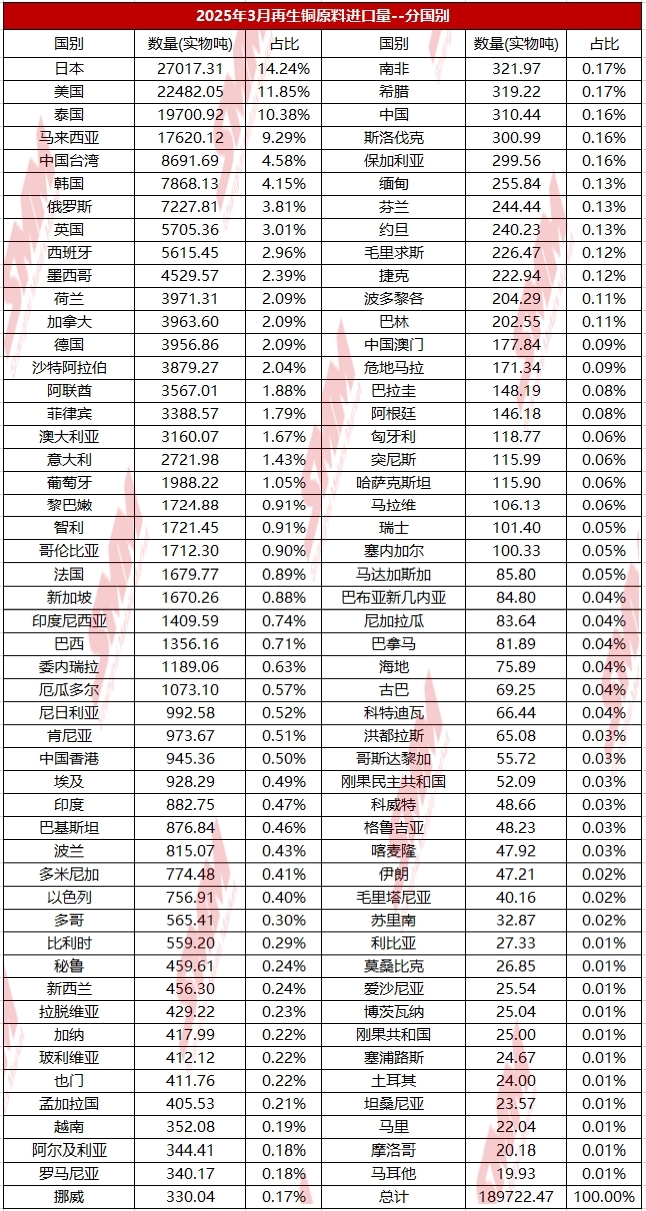
       Looking ahead, according to SMM, the current supply of secondary copper raw materials in the market remains extremely tight, with both domestic and imported sources in short supply. Despite the continued market demand, many traders are actively seeking ways to import secondary copper raw materials, but overseas offers are scarce, making it difficult to achieve large-scale purchases. Furthermore, affected by Trump's tariff policies, traders generally reject US sources, which are more likely to be absorbed in local markets such as Japan and Thailand. In the coming months, imports are expected to maintain a trend of "declining volumes but rising prices," with the market shares of Japan and Thailand expected to exceed 18% and 14%, respectively, while the US share may fall below the psychological threshold of 10%. (The following presents import data by country for March-April 2025.)


Data Source Statement: Except for publicly available information, all other data are processed by SMM based on publicly available information, market communication, and relying on SMM‘s internal database model. They are for reference only and do not constitute decision-making recommendations.

For any inquiries or to learn more information, please contact: lemonzhao@smm.cn
For more information on how to access our research reports, please contact:service.en@smm.cn
Related News
Copper Wire and Cable Inventories Decline as Raw Material and Finished Product Stocks Fall Weekly
6 hours ago
Copper Wire and Cable Inventories Decline as Raw Material and Finished Product Stocks Fall Weekly
Read More
Copper Wire and Cable Inventories Decline as Raw Material and Finished Product Stocks Fall Weekly
[SMM Copper Wire and Cable Weekly Inventory] On weekly copper wire and cable inventory, raw material inventory still mainly declined on consumption this week, so raw material inventory fell 2.84% MoM. As for finished product inventories, with downstream enterprises gradually picking up goods, finished product inventories fell 3.31% MoM.
6 hours ago
Copper Wire and Cable Operating Rate Down 0.81% MoM, 11.11% YoY Amid Weak New Orders
6 hours ago
Copper Wire and Cable Operating Rate Down 0.81% MoM, 11.11% YoY Amid Weak New Orders
Read More
Copper Wire and Cable Operating Rate Down 0.81% MoM, 11.11% YoY Amid Weak New Orders
[SMM Copper Wire and Cable Weekly Operating Rate] This week, the operating rate of SMM copper wire and cable enterprises was 69.95, down 0.81 percentage points MoM. Overall operating performance was stable this week. During the week, copper prices hovered at highs, exacerbating wait-and-see sentiment among downstream enterprises, while new orders remained weak. Enterprises still relied on ample orders on hand to keep production basically stable. By segment, the power sector remained the core support, with orders in NEV and optical fiber performing well, while engineering and construction orders were still hardly optimistic. The operating rate of copper wire and cable enterprises is expected to fall 0.67 percentage points MoM to 69.29 next week
6 hours ago
Market Risk Appetite Weakened, the Most-Traded BC Copper Contract Closed Down 0.84% [SMM BC Copper Commentary]
7 hours ago
Market Risk Appetite Weakened, the Most-Traded BC Copper Contract Closed Down 0.84% [SMM BC Copper Commentary]
Read More
Market Risk Appetite Weakened, the Most-Traded BC Copper Contract Closed Down 0.84% [SMM BC Copper Commentary]
7 hours ago
As the aftermath of the trade war lingers, the import pattern of secondary copper in China is accelerating its restructuring [SMM Analysis] - Shanghai Metals Market (SMM)