On April 9, at the , hosted by SMM Information & Technology Co., Ltd. (SMM), Shandong Aisi Information Technology Co., Ltd., and SMM Trading Center Co., Ltd., and co-organized by Shandong Humon Smelting Co., Ltd., Zambia Development Agency (ZDA), Chalco Luoyang Copper Processing Co., Ltd., and Hetian Commerce and Logistics Group Co., Ltd., Wu Jinkai, Head of the Metals Team at Sinolink Securities Co., Ltd., delivered a presentation on the topic "Computing Power – Electricity – Copper: Repricing the 'New Infrastructure Metal' in the AI Era."
1. From "Traditional Infrastructure Metal" to "AI New Infrastructure Metal": The Shifting Role of Copper
The Shifting Role of Copper: From Supporting Material to Systemic Variable
• Traditional infrastructure phase: In the era of conventional real estate, manufacturing, and legacy power grids, copper was largely viewed as a supporting metal that followed demand expansion; it was important, but rarely became a core variable driving infrastructure investment narratives.
• AI new infrastructure phase: AI data centers are not simply about purchasing more servers, but about rebuilding high-density load infrastructure: as GPU counts rise, they simultaneously boost demand for racks, cooling, power distribution, substations, T&D, and green electricity integration, making copper a systemic variable.
• Implications of the role shift: The marginal pricing anchor for copper is gradually migrating from demand recovery in traditional infrastructure to whether computing power deployment materializes and whether capital expenditure across the power chain steps up to a new level; this means the market should no longer understand AI-driven copper demand solely through a traditional commodity framework.
Why the Old Consensus Underestimated AI-Driven Copper Demand: Overly Conservative Base Assumptions
• Commonality 1: In the past, mainstream research preferred to start from publicly disclosed projects/GW or annual construction volumes. The advantage was clear and verifiable metrics, but the drawback was that it easily overlooked expansions of existing parks, undisclosed projects, and spillover copper consumption extending from racks to the power grid.
• Commonality 2: When the market did not believe AI deployment would materialize at scale, research naturally opted for more defensive parameters: only recognizing project pipelines, only counting the data center facilities themselves, only accounting for capital expenditure already incurred, and refusing to price in downstream supporting infrastructure.
• Commonality 3: Therefore, the market's past underestimation of AI-driven copper demand was not essentially about "copper intensity being off by a few percentage points," but rather about overly conservative front-end assumptions; once GPU shipments demonstrated greater certainty, the model's starting point had to be revised upward across the board.
The Starting Point of the New Consensus: Not Simply Revising Copper Intensity Upward, but Repricing the Guidance
• Demand validation moving forward: Since 2026, agent applications represented by OpenClaw have gone mainstream, enabling the market to see that inference demand, token usage, and commercialization loops are migrating toward real deployment; this has caused the narrative that "AI has no demand" to lose its explanatory power.
• Reassessment of supply guidance: Once demand-side momentum becomes visible, the aggressive guidance on NVIDIA shipments and TSMC's advanced packaging expansion should begin to be priced in, prompting a reassessment of previous copper demand estimates.
• The real expectations gap: Therefore, the dividing line between old and new consensus lies not in 39 t/MW versus 45 t/MW, but in whether the market is willing to price in that expansion will truly materialize in racks, campuses, and the power grid; as soon as the answer shifts from disbelief to belief, copper demand will undergo a systematic reassessment.
2. How AI Data Centers Use Copper: Beyond Racks, Extending to the Power Grid
US Data Center Power Consumption Trends: Power as an Inflationary Factor
• The most widely cited report for AI data center estimates is the *2024 United States Data Center Energy Usage Report*, published in December 2024. We focus our discussion on this report.
• Historical trends (2014–2023): 2014–2016: Power consumption remained stable at approximately 60 TWh per year, continuing the low-growth trend since 2010.
• 2017 turning point: As server installations grew—particularly with GPU-accelerated servers for AI accounting for a significantly larger share of the data center server fleet—data center power consumption began to rebound; consumption reached approximately 76 TWh in 2018, accounting for 1.9% of total annual US electricity consumption.
• 2018–2023: Growth accelerated, with power consumption reaching 176 TWh in 2023, accounting for 4.4% of total US electricity consumption, representing an 18% CAGR from 2018 to 2023.
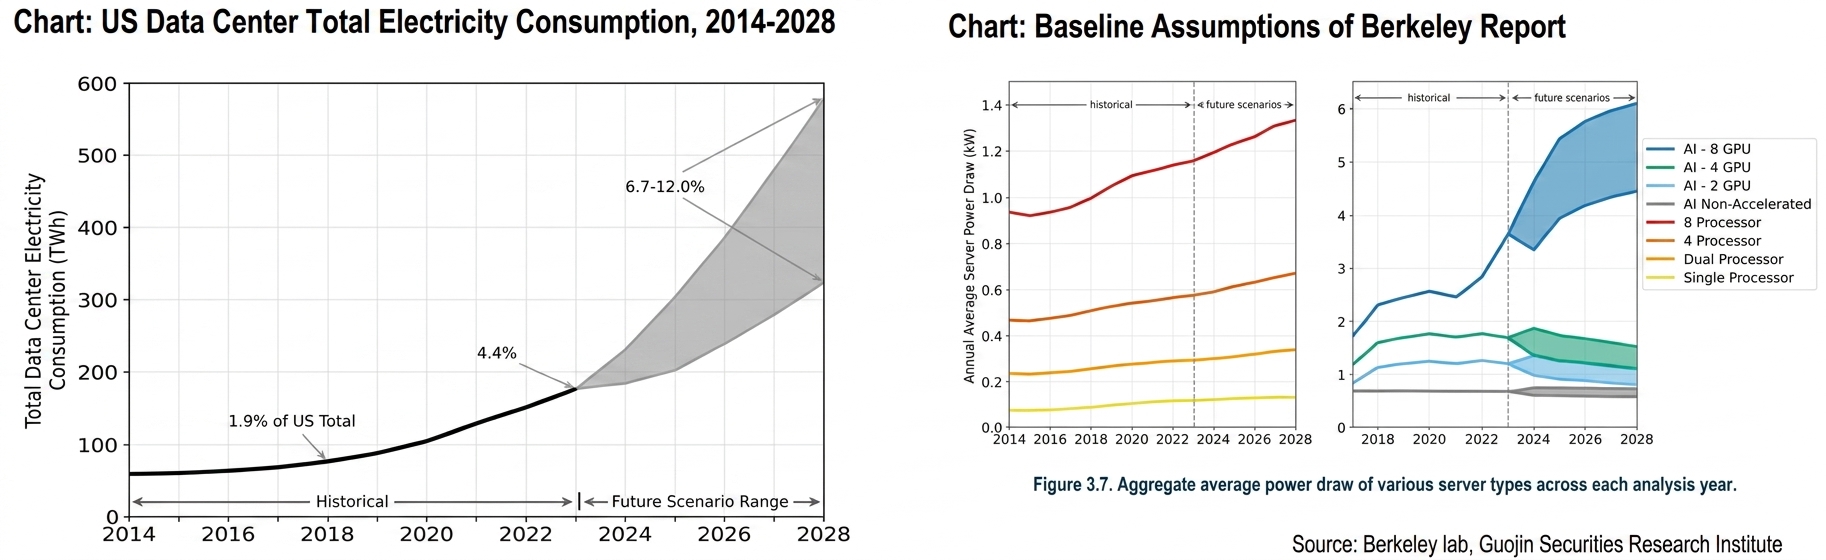
• Future scenario projections (2024–2028): 2028 projected range: Power consumption ranges from a low of 325 TWh to a high of 580 TWh. Assuming an average capacity utilization rate of 50%, this corresponds to total data center power demand of 74–132 GW, accounting for 6.7%–12.0% of projected total US electricity consumption in 2028, with a CAGR of 13%–27% expected from 2023 to 2028.
• From the perspective of assumptions: Upper bound: Based on the IDC 2024b report, assuming sustained AI activity, GPU shipments continuing at H2 2024 growth rates, and manufacturers being able to meet demand; Lower bound: Based on the IDC 2023a report, assuming AI activity enthusiasm pulls back, with GPU shipment growth reverting to pre-2024 historical average levels (e.g., 70%–80% of the 2021–2023 growth rate). Currently, using the upper bound as the basis for estimation appears more reasonable.
• The report's estimates are based on AI 8-GPU racks, whereas current racks are NVL72, containing 72 cards. Theoretically, power consumption should be 9 times that of AI 8-GPU racks, but actual NVL 72 rack power consumption is approximately 15 times higher, indicating severe power inflation on the cooling side.
• Considering GPU upgrades and increased power consumption, we estimate electricity consumption will reach at least 800 TWH by 2028.
Calculation results: US power grid copper consumption to increase by nearly 2.1 million mt compared to 2025 by 2030
• AI's boost to copper demand is primarily driven through electricity consumption. US electricity consumption in 2023 was 4,000 billion kWh. According to the aforementioned Berkeley Lab, data center electricity consumption in 2023 was 176 billion kWh, accounting for 4.4% of total US electricity consumption. Based on our revised forecast, by 2028, electricity consumption is expected to range from a low of 580 billion kWh to a high of 800 billion kWh, contributing incremental electricity consumption of 404–624 billion kWh, accounting for 10%–15.6% of incremental electricity consumption in total.
• Under this scenario, we calculated the copper and aluminum demand for the US power grid. By 2030, the boost to copper and aluminum from data centers, manufacturing reshoring, and new energy is expected to increase by 2.1 million mt and 3.71 million mt respectively compared to 2025. From a product structure perspective, copper demand is primarily boosted by wires & cables and transformers, while aluminum is primarily boosted by wires & cables and substations.
How AI Data Centers Use Copper: Three-Layer Pathway
• Three-layer framework: Before discussing AI copper usage, it is essential to first clarify the scope: in-rack/near-rack primarily covers servers and proximity networks; out-of-rack but on-site primarily covers power distribution and cooling; further out covers substations, T&D, and green electricity connections supporting incremental loads.
• Most common misconception: The market tends to equate "server BOM" with "total copper consumption of AI data centers"; however, for high-density training clusters, in-rack accounts for only a small portion, with the real bulk lying in on-site power chain and cooling.
• Research requirements: All subsequent calculations must simultaneously answer three questions: whether the scope is in-rack or the entire campus, whether it is greenfield or expansion, and whether it covers only the facility itself or also incorporates the external power chain. Only then can different reports be truly comparable.
39 mt/MW Is Not "Rack BOM" but the Full Electrical System Intensity of AI Training Data Centers
• Intensity meaning: The 39 mt/MW figure from S&P does not mean "39 mt of copper installed in a single rack," but rather represents the comprehensive intensity under the direct copper scope for AI training hyperscale data centers; high-redundancy designs in China can even reach 47 mt/MW.
• Structural meaning: Breaking down by sub-item median values, the power chain accounts for approximately 61% of direct copper, cooling approximately 22%, and server + network only 17%; in other words, most copper is not in the GPU itself but in the systems that supply power to and dissipate heat from the GPU.
• Investment meaning: This is also why we later switch from "mt/rack" back to "mt/MW": as long as power density continues to rise, power chain copper consumption will scale accordingly; even if fiber optics replace some copper cables, it is only a partial offset and does not change the overall logic.
120kW cabinet: greenfield 7.8 mt, expansion 6 mt, infill 4.25 mt
•Using the NVIDIA NVL72 ~120kW cabinet as a reference, based on the greenfield new-build average, the total system copper consumption per cabinet is approximately 7.8 mt; this scope includes on-site direct usage and a rough allocation of off-site power-side consumption.
•However, current mainstream AI deployments do not always start from scratch at every campus. More commonly, expansion and partial reuse of existing grid connections, main power distribution, and cooling trunk lines occur within existing campuses. Therefore, the expansion scope is better represented by 5.5–6.5 mt/cabinet, with a midpoint of approximately 6 mt.
•For pure infill scenarios, where existing infrastructure is extensively reused, copper consumption per cabinet can be further reduced to 3.5–5 mt/cabinet.
Core model: deriving copper demand directly from GPU count
•This version of the core model no longer works backward from aggregate figures, but instead models sequentially from "GPU count → cabinet count → power → electricity consumption → copper consumption." This approach directly translates advanced packaging, cabinet power, and expansion pace into copper demand.
•Baseline assumptions: NVIDIA 7 million GPUs and Google 5.5 million GPUs in 2026; GPU counts for both companies growing at +50% per year from 2027 to 2030. Cabinet assumptions are NVIDIA 72 GPUs/120kW and Google 64 GPUs per cabinet; the deployment scope uses a campus expansion midpoint of 6 mt/cabinet.
•Under this framework, "how much copper per 1 million high-end AI GPUs corresponds to" becomes a repeatable and updatable paradigm, rather than an abstract macro discussion.
NVIDIA: the first independent main thread
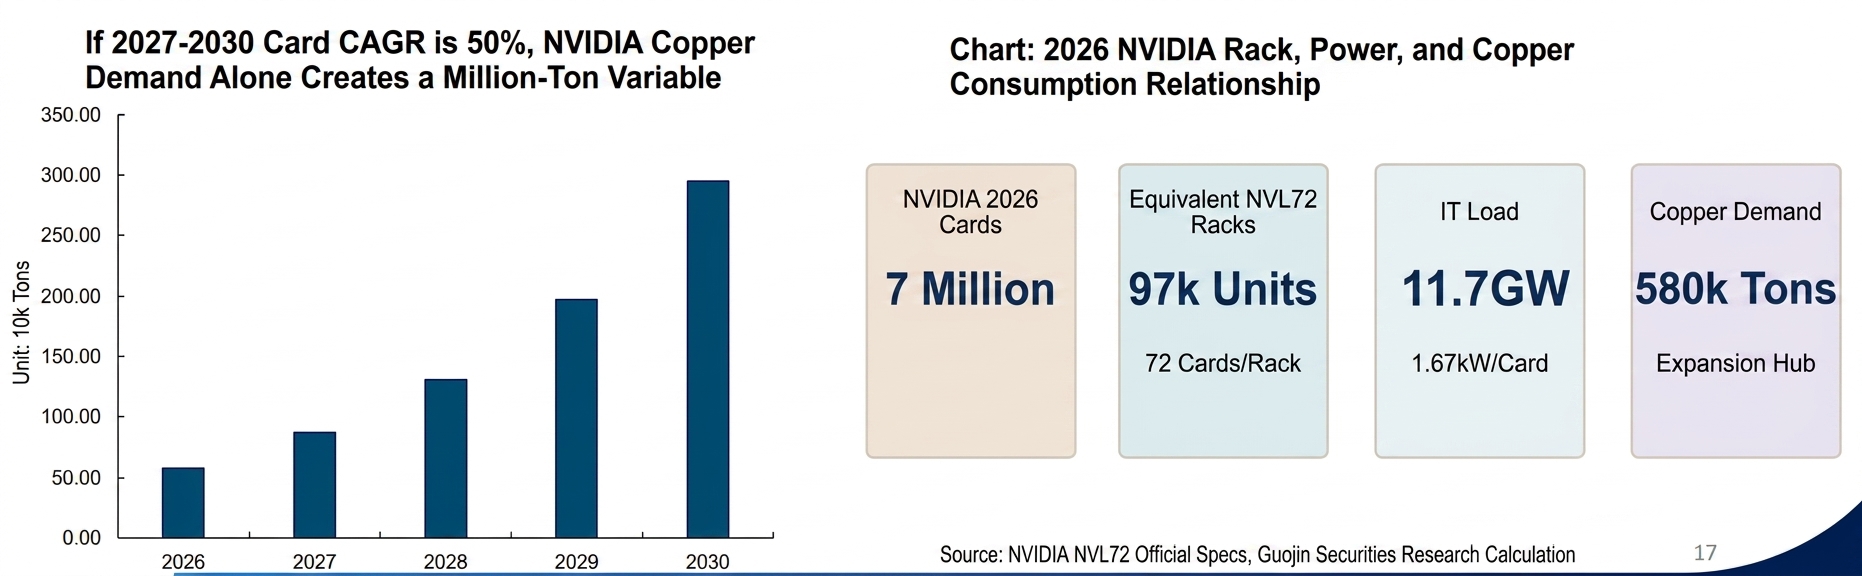
•2026 starting point: under the base case, NVIDIA is projected to have approximately 7 million GPUs in 2026. Converting at 72 GPUs/120kW NVL72-equivalent cabinets, this roughly corresponds to 97,000 cabinets, 11.7 GW of IT load, and approximately 14 GW of facility load; even looking at just one company, the scale is already very substantial.
•Copper consumption path: under the campus expansion scope, NVIDIA alone has a midpoint annual copper demand of approximately 580,000 mt in 2026; if deployment continues at a 50% annual growth rate from 2027 to 2030, this could rise to approximately 2.95 million mt/year by 2030 for this single company.
•Research implication: the most important significance of these figures is not their precision down to the last digit, but rather that they demonstrate: as long as the market believes the guidance will be delivered, NVIDIA alone is sufficient to elevate AI-driven copper demand into a balance-sheet-level variable, rather than merely a thematic investment.
Google: the second independent main thread
•Not a supplementary item: in our base case, Google is not a "supplementary item" but rather the second independent main thread. Based on 5.5 million GPUs in 2026 at 64 GPUs/cabinet, this translates to approximately 86,000 cabinets, 9.2 GW of IT load, and 11 GW of facility load — a scale already not far from NVIDIA's first-year deployment.
• Copper consumption path: Since we applied "per-card copper consumption equivalence" under the expanded capacity framework, Google's annual copper demand midpoint in 2026 was approximately 460,000 mt; if similarly advancing at a 50% annual growth rate, by 2030 a single company would correspond to approximately 2.32 million mt/year of copper demand.
• Conclusion significance: Therefore, Google should not be viewed as a minor adjustment outside of NVIDIA; as long as hyperscaler in-house ASIC roadmaps also expand in parallel, AI-driven copper demand is not a single GPU leader narrative, but a narrative where multiple computing power routes collectively push up power capex.
Two companies combined: ~5.27 million mt midpoint by 2030 at 50% annual growth rate
• Combined result: After merging NVIDIA and Google, under the 2026 midpoint scenario, annual copper demand already reached approximately 1.04 million mt; if growing at 50% annually thereafter, the midpoint could reach approximately 5.27 million mt by 2030, with the low-to-high range roughly at 4.64–5.94 million mt.
• Release pace: More importantly, the release pace: this is not a one-time story of "using up all the copper in the first year," but rather a front-low-back-high deployment curve; as card counts, rack counts, and MW levels rise in tandem, the slope of annual incremental copper demand will steepen progressively.
• Market significance: Precisely because of this, if the market still uses the old framework of "a few hundred thousand mt" to understand AI-driven copper demand, it can easily underestimate the non-linearity in the mid-to-late stages; for a commodity like copper with a tight balance sheet, what truly matters is often not the first year, but the slope after the third year.
3. AI High-Frequency Data Continues to Deliver: Not Just a Narrative, but Reality
Copper Monthly Physical Flow Tracking: China
• In Feb 2026, China's apparent demand declined YoY, -10% YoY. Feb China copper cathode production was 1.09 million mt, down 100,000 mt YoY, with imports remaining at low levels. For the first 2 months, apparent demand fell 131,000 mt YoY, of which domestic demand declined 324,000 mt and external demand added 303,000 mt. Global demand for the first 2 months of 2026 was estimated to have declined 19,000 mt, with domestic demand falling significantly both YoY and MoM, while external demand support slowed down.
• On fabricated product exports, auto and transformer export growth maintained high YoY increases. On a MoM basis, only transformer exports remained at elevated levels, while exports in other segments all declined MoM, with wire and cable exports declining notably MoM. Fabricated product exports fell 1,000 mt in the first 2 months, indicating weak copper fabricated product export demand.
Copper Monthly Physical Flow Tracking: US
• In Oct, US apparent demand was -12% YoY, with cumulative first 10 months at +22% YoY, adding 412,000 mt of new demand. Considering the solid performance of power sector demand, an estimated 200,000 mt of the 374,000 mt in new demand was actual demand growth, with cumulative hidden inventory of 212,000 mt. Combined with Oct COMEX inventory of 340,000 mt, total hidden + visible inventory in the US region was estimated at 552,000 mt.
• In October, regarding US net imports of fabricated products, wires & cables, transformers, and computers were the main contributors to incremental growth, while auto net imports continued to decline. Power equipment (wires & cables + transformers) accounted for 128% of the incremental demand relative to total import demand, with autos being a significant drag. AI's boost to copper usage in power grids continued to materialize, as already reflected in high-frequency data. Wires & cables plus transformers combined added 281,000 mt, with annualized US power-related copper imports estimated at approximately 350,000 mt in 2025.
• The decline in power equipment imports was likely attributable to two factors: 1) The rush to import and restock in H1 ended, with weakened urgency to front-load imports in H2; 2) Rising domestic market share in the US — after the 2025 tariffs, US domestic companies saw notable increases in sales volume, with AKTR/HUBB/POWL showing significant rises, expected to substitute for imports. Combining the above analysis, with domestic demand increase plus incremental imports, US copper demand for power grids was no less than 400,000 mt.
Seven US Tech Giants Sign Self-Supply Power Commitment
• Representatives of seven companies — Microsoft, Google, OpenAI, Amazon, Meta, xAI, and Oracle — signed relevant documents at the White House. US President Trump stated that many Americans were concerned that data centers would push up power demand and potentially raise electricity bills, but this document would resolve the issue. Meanwhile, the bearer of tariff costs also became clearer — the AI giants themselves.
• Previously, there were two key questions about US power grid construction: utilities lacked the capability to build; and utilities lacked the willingness to build. With the signing of this document, the pathway for US power grid construction has been cleared. The seven giants have both the capability and willingness to invest in power supply construction, and self-built power plants would not affect copper demand deployment. High voltage/extra-high voltage (HV/EHV): responsible for long-distance power transmission and large-scale backbone grids; typical equipment: power transmission lines, main substations (step-up/step-down), and large switching stations.
• Medium voltage (MV): responsible for campus-level power distribution, delivering electricity to each zone; typical equipment: distribution stations, ring main units/switchgear, MV cables, and distribution transformers (MV→LV).
• Low voltage (LV): responsible for the last segment within server rooms, delivering electricity to loads; typical equipment: LV switchgear, busways/cables, PDUs, UPS (mostly on the LV side), and server power supplies.
• Following the signing of this document, we expect demand for wires & cables to accelerate.
Copper Monthly Physical Flow Tracking: Europe
• In October, European apparent demand was -4% YoY. Fabricated product imports for the first 10 months were +63% YoY, with October alone surging +48% YoY. The core incremental growth came from wires & cables, while the share of auto exports increased.
•In the first 10 months, new demand from European wire & cable and transformers totaled 140,000 mt, with full-year new power grid demand in Europe estimated at 160,000-180,000 mt.
4. Risk Warnings
Risk Warnings
•AI demand falls short of expectations
•Aluminum as a substitute for copper exceeds expectations