In recent years, the most common and straightforward framework for assessing demand across the lithium battery value chain has been to anchor it to EV sales. The logic was simple: the more vehicles sold, the stronger the battery demand; conversely, a slowdown in vehicle sales would imply weaker battery demand. This relationship held true in the early stages of the industry, when EV penetration was rapidly increasing, product structures were relatively simple, and battery demand exhibited a strong linear correlation with vehicle sales.
However, this linear relationship is now clearly weakening. Increasing evidence suggests that battery demand is no longer solely determined by vehicle sales, but is increasingly driven by multiple factors, including average battery capacity per vehicle, product mix, commercial vehicle electrification, and export dynamics.
1. The “Vehicle Sales = Battery Demand” Formula Is Breaking Down
At its core, vehicle sales represent the number of units sold, while battery demand reflects total energy consumption, i.e., total installed battery capacity. These two metrics only move in tandem when the average battery capacity per vehicle remains stable.
Once average battery size increases, or when the sales mix shifts across BEV vs. PHEV, passenger vs. commercial vehicles, the direct linkage between vehicle sales and battery demand begins to decouple.
As a result, assessing battery demand today requires answering several additional questions beyond headline vehicle sales:
-
What is the average battery capacity per vehicle?
-
Which vehicle segments are driving incremental growth?
-
Are export flows and regional differences amplifying demand volatility?
In other words, the industry is transitioning from a “unit-driven” model to an “energy-driven” model.
2. Rising Battery Capacity per Vehicle: The Primary Driver
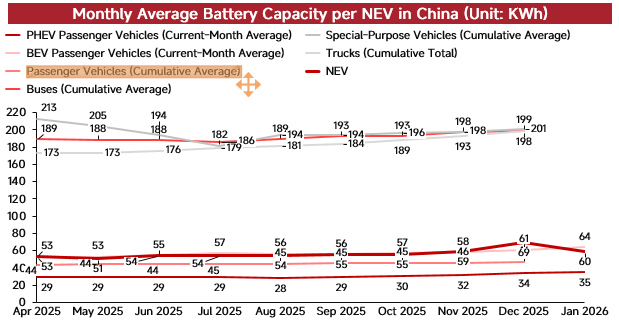
The most direct reason for the decoupling is the continuous increase in battery capacity per vehicle. This trend is driven by three key factors.
First, vehicle upsizing. Both in China and overseas, EV consumption is shifting from basic electrification to enhanced user experience. The rising share of SUVs, pickup trucks, larger sedans, and premium vehicles naturally drives higher battery capacity per vehicle. Larger vehicle size, longer range requirements, and higher performance expectations all translate into higher kWh configurations.
Second, the range competition is not over. While the industry has moved beyond the most aggressive phase of “range-at-all-costs,” consumers still place strong emphasis on real-world range, low-temperature performance, highway efficiency, and charging convenience. Even amid intense price competition, automakers are reluctant to reduce battery capacity, as it remains a core determinant of product competitiveness.
Third, the growth of premium BEVs and heavy-duty applications. Although EV sales growth is expected to moderate going forward, battery demand is still projected to grow at a faster pace, with increasing battery capacity per vehicle being a key contributor. This reflects a critical shift: vehicles may not be selling faster, but each vehicle is consuming more battery capacity.
Therefore, relying solely on slowing vehicle sales growth to infer weaker battery demand may significantly underestimate the offsetting effect from rising battery capacity per vehicle.
3. Product Mix Matters More Than Total Sales Volume
Beyond battery capacity, changes in product mix are also reshaping battery demand.
For instance, selling one million EVs with a higher BEV share will result in stronger battery demand than the same volume with a higher PHEV share, due to differences in battery size. In other words, shifts between different powertrain technologies directly impact overall battery intensity.
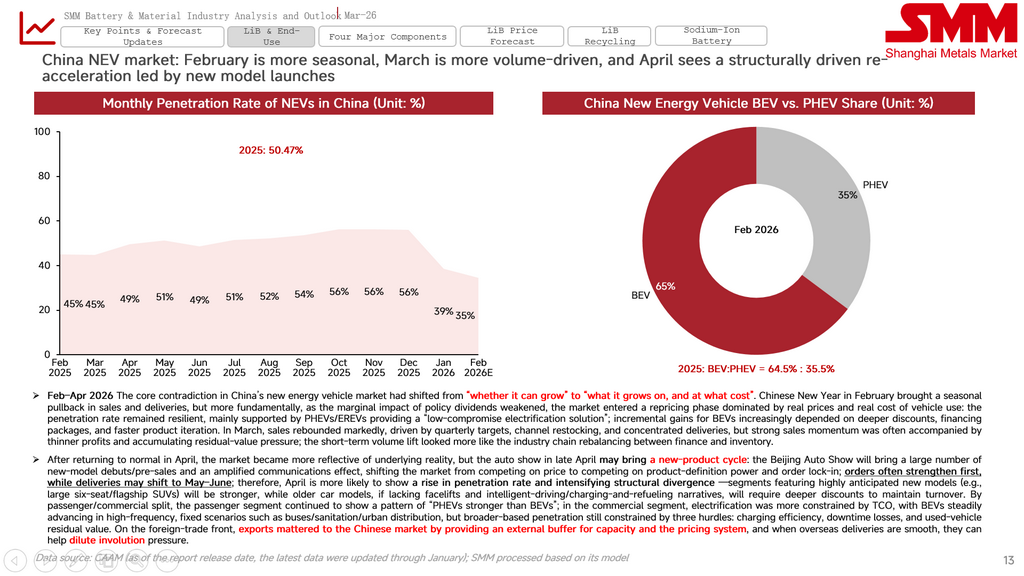
Globally, this structural divergence is becoming more pronounced. In Europe, policy adjustments have led to a temporary rebound in PHEVs, which dilutes average battery capacity per vehicle. In contrast, China continues to maintain a high share of BEVs and higher-capacity vehicles, supporting stronger battery demand intensity.
Thus, evaluating battery demand today requires understanding not just how many vehicles are sold, but what types of vehicles are driving the growth.
4. Commercial Vehicle Electrification: The Most Undervalued Growth Driver
If rising battery capacity per vehicle represents the first layer of demand restructuring, then the electrification of commercial vehicles represents the second—and arguably the most underestimated—layer.
Passenger EVs typically carry battery packs in the range of tens of kWh, whereas electric heavy-duty trucks, construction vehicles, and specialty vehicles often require 300–600 kWh or more. This means that a single electric truck can generate battery demand equivalent to multiple passenger EVs.
Even with a smaller sales base, incremental penetration in commercial vehicles can significantly amplify overall battery demand.
Rising oil prices further accelerate this trend by improving the total cost of ownership (TCO) of electric commercial vehicles, particularly in high-utilization, heavy-load, and fixed-route applications. In such scenarios, electrification becomes economically compelling much faster.
As a result, while commercial vehicles are not the largest segment by volume, they are likely to become one of the most powerful “energy leverage” drivers of battery demand in the near term.
5. Exports, Inventory Cycles, and Production Scheduling Are Increasing the Mismatch
In addition to end-market dynamics, midstream factors such as exports, inventory cycles, and production scheduling are further widening the gap between vehicle sales and battery demand.
On one hand, changes in export policies, overseas customer stocking behavior, and shifts in trade flows can either front-load or delay battery and materials production.
On the other hand, inventory cycles are once again becoming a central analytical framework. Automakers and distributors are no longer maintaining stable inventory levels; instead, they dynamically adjust stocking based on sales trends and pricing competition.
This means that battery production is increasingly influenced by inventory drawdowns, restocking cycles, and order visibility—rather than simply mirroring real-time vehicle sales.
Analyst
SMM Lithium Battery Analyst
Lesley Yang
yangle@smm.cn
![[Lijian-2 Rocket’s Post-Recovery Cost Expected to Drop to Half of SpaceX’s]](https://imgqn.smm.cn/usercenter/zWZVI20251217171730.jpg)