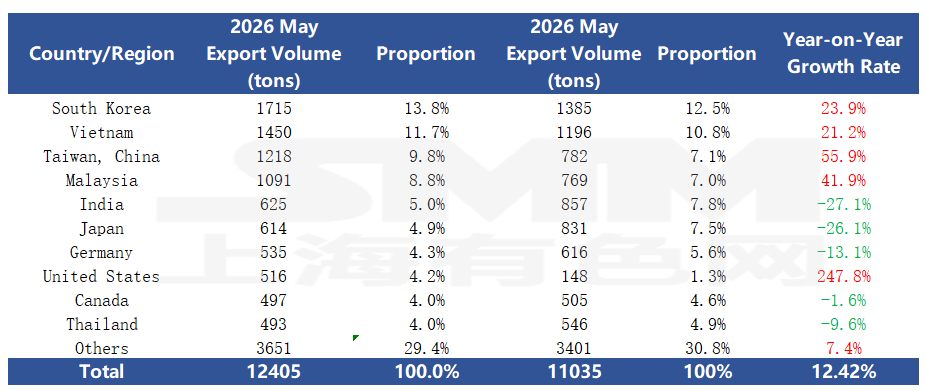
According to data from the General Administration of Customs, in May 2026, China's copper plate/sheet and strip exports totaled 12,405.48 mt, up 1.3% MoM and 12.42% YoY; from January to May, cumulative exports of copper plate/sheet and strip reached 57,893.07 mt, a cumulative increase of 15.57% YoY.
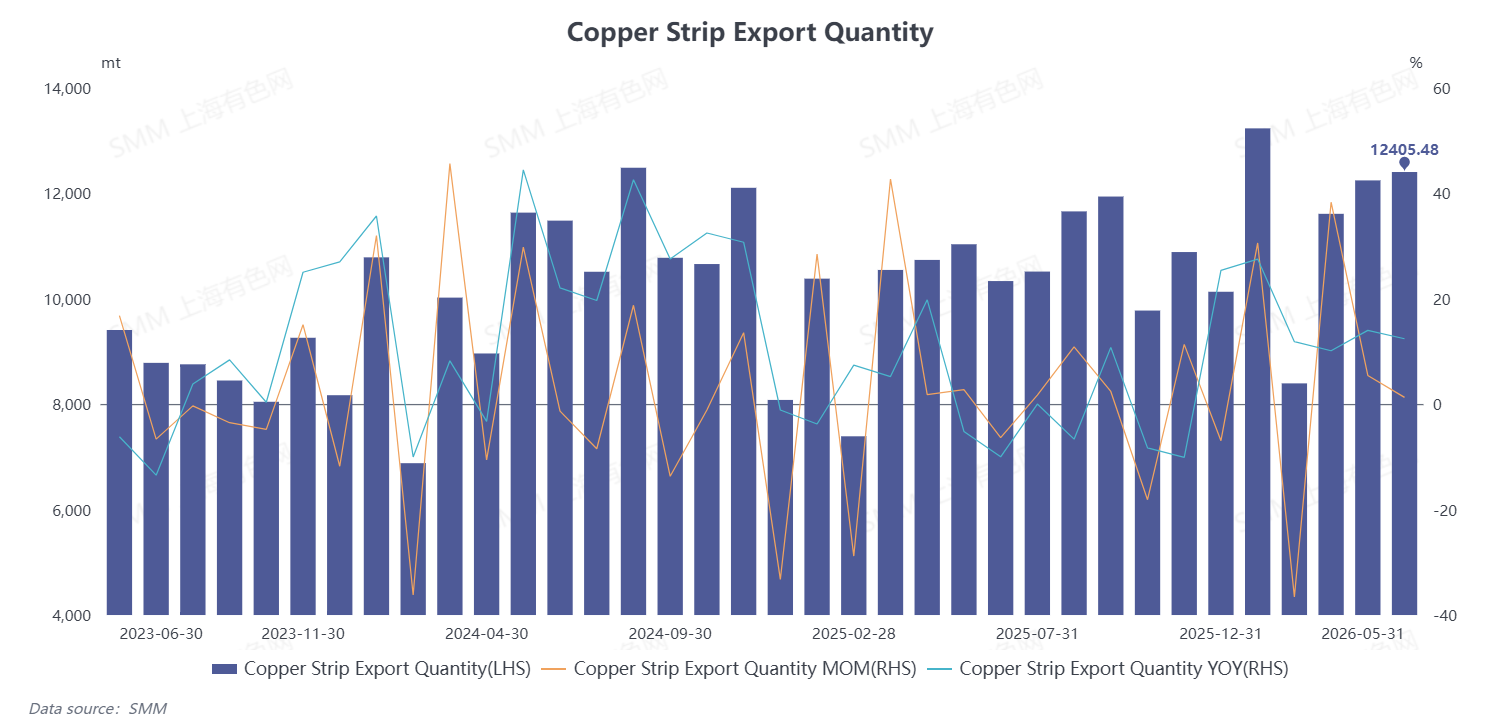
In May 2026, China's copper plate/sheet and strip exports maintained steady growth, with total exports of 12,405 mt, up 12.42% YoY, reaching 101 countries and regions, as the diversification of export markets continued to deepen. By region, South Korea, Vietnam, and Taiwan, China were the top three core export markets, together accounting for nearly 35% of total exports. Among them, exports to Taiwan, China surged 55.9% YoY, lifting its share to 9.8%; exports to South Korea and Vietnam increased 23.9% and 21.2% YoY respectively, with demand remaining positive. Canada saw the most outstanding growth, with May exports soaring 247.8% YoY. In addition, exports to India, Japan, Germany, and Thailand all declined to varying degrees YoY. Overall, overseas copper plate/sheet and strip exports stayed high, with ample growth resilience.
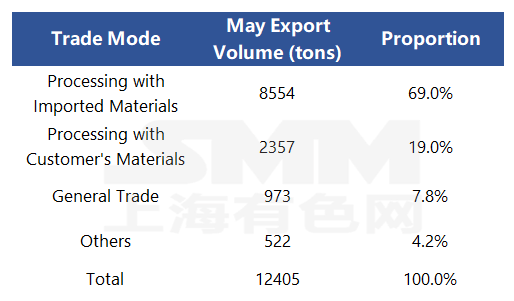
China's copper plate/sheet and strip export trade mode structure continued its previous pattern. Customs data showed that in May, processing trade with imported materials remained the core export mode, with exports reaching 8,554 mt, accounting for 69% and holding a dominant position; exports under Processing and Assembling trade totaled 2,357 mt, with its share rising to 19%; exports under Ordinary Trade stood at 973 mt, with its share up to 7.8%; exports under other trade modes reached 522 mt, with its share falling to 4.2%.
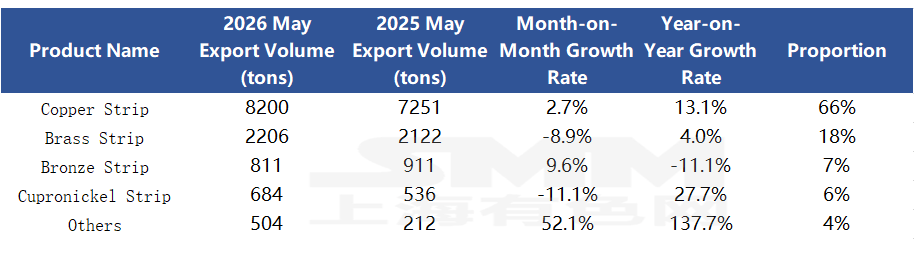
By category, China's copper plate/sheet and strip export structure showed significant divergence in May 2026. Copper strip remained the absolute dominant export product, with exports of 8,200 mt, accounting for 66% of total exports, edging up 2.7% MoM and rising 13.1% YoY, its incremental contribution ranking first among all categories. Brass strip exports were 2,206 mt, accounting for 18%, edging up 4.0% YoY but pulling back 8.9% MoM. Cupronickel strip and other copper semis exports surged YoY, with cupronickel strip at 684 mt, up 27.7% YoY but down 11.1% MoM; other copper semis exports stood at 504 mt, jumping 52.1% MoM and surging as much as 137.7% YoY, reflecting remarkable progress in expanding exports of niche categories. Bronze strip underperformed, with exports of 811 mt in the month, up 9.6% MoM but down 11.1% YoY, as demand outside China contracted somewhat. Overall, conductive copper strip underpinned export volumes, while exports of specialty alloys and niche copper semis surged, and only bronze strip saw weakening demand outside China.
Data Source: General Administration of Customs
(HS codes 74091110, 74091190, 74091900, 74092100, 74092900, 74093100, 74093900, 74094000, 74099000)