Monday, 09/02/2026 | 17:31 GMT+8 by Damian Chmiel
- Gold surged 1.30% to $5,033 on Monday, February 9, 2026, reclaiming the critical $5,000 psychological level.
- Wells Fargo Investment Institute dramatically upgraded its year-end gold price forecast to $6,100-$6,300.
- China's central bank extended its gold buying spree for the 15th consecutive month with holdings rising to 74.19 million ounces.
Gold price surged above $5,000 on Monday, February 9, 2026, trading at $5,033 after gaining 1.30% as Wells Fargo Investment Institute dramatically upgraded its year-end forecast to $6,100-$6,300.
The revision comes as China's central bank extended its gold buying spree for the 15th consecutive month, with holdings rising to 74.19 million fine troy ounces valued at $369.58 billion. Gold has now gained 9.45% over the past month and 72.50% year-over-year despite extreme volatility that saw a 21% drawdown before recovering.
In this article, I am answering the question of why gold is going up today, analyzing the XAU/USD chart and checking the newest gold price predictions.
Follow me on X for more gold market analysis: @ChmielDk
Gold Reclaims $5,000: Path to ATH Reopens
Gold returned above the critical $5,000 psychological level on Monday, trading at $5,033, after spending the previous week below this threshold. The recovery extends gold's remarkable resilience following violent late January and early February selloffs that saw single-day losses of up to 9%.
Over the past 30 days, gold has gained 9.45% despite a brutal 21.3% drawdown that briefly pushed prices to $4,400 before buyers stepped in aggressively. The recovery found support exactly where my technical analysis predicted: at the 50-day exponential moving average around $4,550-$4,600, which coincides with late 2025 historical highs.
From my technical analysis perspective, if gold maintains its position above $5,000 at the beginning of the week, it opens the path again toward resistance around $5,400 per ounce, which I identify on the daily chart as the previous all-time high zone. As a reminder, we drew the current ATH on January 29 at nearly $5,608 per ounce.
Gold is currently trading around $4,960-$5,033 across various markets, representing a significant recovery from recent lows.
Gold Price Predictions
How High Can Gold Go? Wells Fargo's Shocking 40% Forecast Upgrade
Wells Fargo Investment Institute announced on February 4, 2026, that it now expects gold to reach $6,100-$6,300 by the end of 2026, up from its previous forecast of just $4,500-$4,700. This represents a 35-40% increase in a single revision, vaulting Wells Fargo to among the most bullish major banks alongside JPMorgan.
"The prospect for lower short-term interest rates and the potential to hedge against accelerating policy surprises prompt us to raise our 2026 gold target," Wells Fargo stated in its Wednesday note. The bank emphasized that "such conditions should encourage further central-bank buying," which has been a primary driver of gold's multi-year bull run.
From current levels around $5,033, Wells Fargo's target implies 21-25% upside over the next ten months. The magnitude of this upgrade reflects a fundamental shift in how major institutions view gold's trajectory amid mounting concerns about currency stability and geopolitical risks.
However, Wells Fargo noted an important caveat: "Central-bank purchases slowed in 2025 even as retail buying surged, especially into exchange-traded funds." The bank warned that "historically, retail investors often include speculators who may sell quickly on headlines," pointing to the 9% single-session drop on January 30 after Fed Chair nominee news.
Wall Street Consensus Shifts Decisively Above $6,000
Wells Fargo's upgrade solidifies a remarkable consensus among bullish major banks, nearly all of which now target $6,000 or higher for year-end 2026:
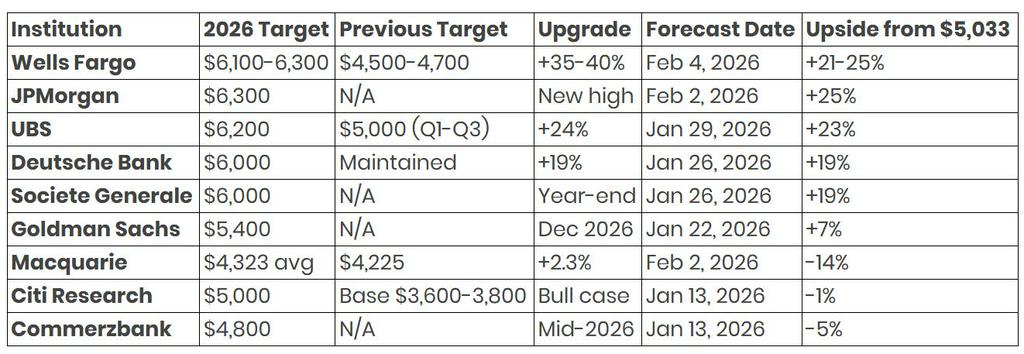
The clustering of forecasts around $6,000-6,300 among the most influential banks, Wells Fargo, JPMorgan, UBS, and Deutsche Bank, represents a powerful consensus that gold's bull market has substantial room to run.
JPMorgan, which issued its $6,300 forecast on February 2, projects central banks will acquire approximately 800 tons of gold in 2026, referencing "an ongoing trend of diversifying reserves that shows no signs of waning". The bank stated: "Despite the recent short-term fluctuations, we remain strongly optimistic about gold in the medium term, driven by a clear, structural trend of continued diversification that is likely to persist in an environment where real assets continue to outperform paper assets."
For broader context, Goldman Sachs previously set a more conservative $5,400 target, while Ron Paul's extreme forecast of $20,000-$100,000 reflects his "fiat system dying" thesis, and one analyst even projects $10,000 gold.
Why Gold Is Surging?
China's 15-Month Gold Buying Spree: Strategic Repositioning
China's central bank extended its gold acquisition program for the 15th consecutive month in January, with holdings rising to 74.19 million fine troy ounces by the end of January, up from 74.15 million the previous month. The value of China's gold reserves surged to $369.58 billion at the end of last month from $319.45 billion in December, reflecting both continued purchases and price appreciation.
Rania Gule, Senior Market Analyst at XS.com MENA, emphasizes the strategic nature of these purchases: "The People's Bank of China has continued purchasing gold for the fifteenth consecutive month, clearly signaling a long-term repositioning rather than a temporary move."
She identifies this as part of a broader shift away from dollar dependence. "From my perspective, the most sensitive factor at this stage is the escalation of concerns regarding the independence of the US Federal Reserve, particularly following recent political statements that have blurred the lines between monetary policy and executive authority."
Federal Reserve Independence Concerns Drive Safe-Haven Demand
Beyond China's strategic purchases, Rania Gule identifies growing concerns about U.S. monetary policy independence as a critical driver of gold's surge above $5,000.
"At a highly significant moment for global markets, this move is not merely an exceptional price fluctuation, but rather a direct reflection of deeper shifts in the structure of the global monetary system and in the balance of confidence between currencies and assets," Gule explains.
Technical Analysis: $5,000 Key Threshold, $5,400 Resistance Ahead
Dilin Wu, Research Strategist at Pepperstone, identifies the current technical landscape: "Gold remains in a consolidation pattern, with $5,000 as a key level. Geopolitical risks, central bank buying, and a softer dollar provide support."
Over the past week, Wu notes, "gold has traded within a wide range. Repeated shifts in geopolitical developments, combined with swings in trader risk appetite, have limited the metal's ability to trend unilaterally. Meanwhile, ongoing central bank purchases and a temporarily weaker dollar have provided solid support for gold's downside."
The consolidation range has been substantial. "Gold briefly dipped to around $4,400 last week but remained largely within the $4,630-$5,100 range," Wu observes. "Long and short positions have alternated frequently, with daily charts showing multiple long bodies and extended wicks, indicating significant intraday swings."
Although gold closed the previous week up 1.6%, Wu cautions that "in the current high-volatility environment this appears more like a repricing of risk rather than a clear return of a bullish trend."
From my technical perspective, the key levels are clear:
Current Position: $5,033
Gold has successfully reclaimed the $5,000 psychological level, which serves as the most important near-term support.
Resistance: $5,400
If notowań złota maintains above $5,000 at the beginning of the week, it opens the path toward resistance around $5,400, which I identify on the daily chart near the previous ATH zone.
Support Zone 1: $4,550-$4,600
If gold fails to hold above $5,000, support arrives at the 50-day EMA around $4,550-$4,600, which extends to late 2025 historical maximums. This is exactly where the three-day gold selloff stopped in early February, and it's where I would expect greater accumulation of buy orders.
Support Zone 2: $4,360
This entire support area extends down to $4,360, where October peaks sit.
Bear Invalidation: $3,900
The ultimate support zone consists of November 2024 lows combined with the 200 EMA around $3,900. In terms of technical corrections, gold still has plenty of room for downside movement before threatening the long-term bull market structure.
Gold Dominates CFD Trading Amid Volatility
The extreme volatility in gold prices has made it the dominant instrument for CFD traders seeking to capture massive intraday swings. Gold has dominated trading volumes at major brokers like Axi, with institutional and retail participants drawn to the 9% daily moves and rapid $1,000+ reversals that characterized late January and early February.
This heightened trading activity itself contributes to volatility, as leveraged positions amplify both rallies and selloffs. The January 30 flash crash that saw gold plunge 9% in a single session demonstrated how quickly sentiment can shift when margin calls and stop-losses cascade.
While major banks cluster around $6,000-6,300 targets, not all analysts share this optimism. Scope Markets EU CEO previously warned that Wall Street's $6,000 gold price targets may be setting a retail trap, suggesting major institutions could be distributing to retail investors at elevated levels.
FAQ, gold price analysis
Why is gold surging today?
Gold surged 1.30% to $5,033 on Monday, February 9, 2026, reclaiming the critical $5,000 psychological level after trading below it for a week. China's central bank extended its buying spree for the 15th consecutive month, with holdings rising to 74.19 million ounces valued at $369.58 billion. Wells Fargo dramatically upgraded its year-end target to $6,100-6,300 (from $4,500-4,700) on February 4, citing "lower short-term interest rates and potential to hedge against accelerating policy surprises".
How high can gold go in 2026?
Wells Fargo's February 4 upgrade to $6,100-6,300 represents the highest year-end target among major banks, implying 21-25% upside from current $5,033. JPMorgan matches this at $6,300, while UBS targets $6,200 and Deutsche Bank $6,000. Goldman Sachs is more conservative at $5,400. The bullish consensus centers on 800 tons of forecast central bank purchases and "real assets continuing to outperform paper assets" according to JPMorgan. However, Citi's bearish base case of $3,600-3,800 warns of potential 24-28% downside.
Should I buy gold now?
Gold at $5,033 sits 10% below its January 29 ATH of $5,608 but up 72.50% year-over-year and 9.45% over the past month despite extreme volatility. Technical support exists at $5,000 (psychological), $4,550-4,600 (50 EMA where early February selloff stopped), and $3,900 (200 EMA bear invalidation).
![Silver Prices Fluctuate and Consolidate, Pre-Holiday Consumption Weakens, Spot Premiums Adjust [SMM Daily Review]](https://imgqn.smm.cn/usercenter/VCNvX20251217171735.jpeg)