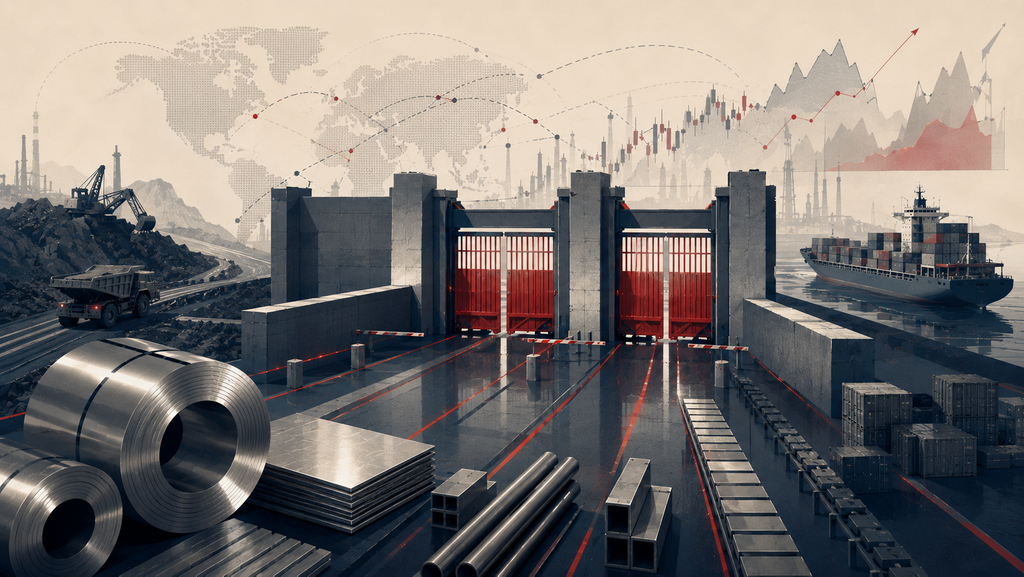
Tightening supply policy in Indonesia, new import quotas and carbon costs in the EU, and tariff walls in the US pushed benchmark stainless steel prices higher across nearly every major market in the first half of 2026 — even as real demand stayed weak everywhere, turning global trade increasingly into a fight over market access rather than supply and demand.
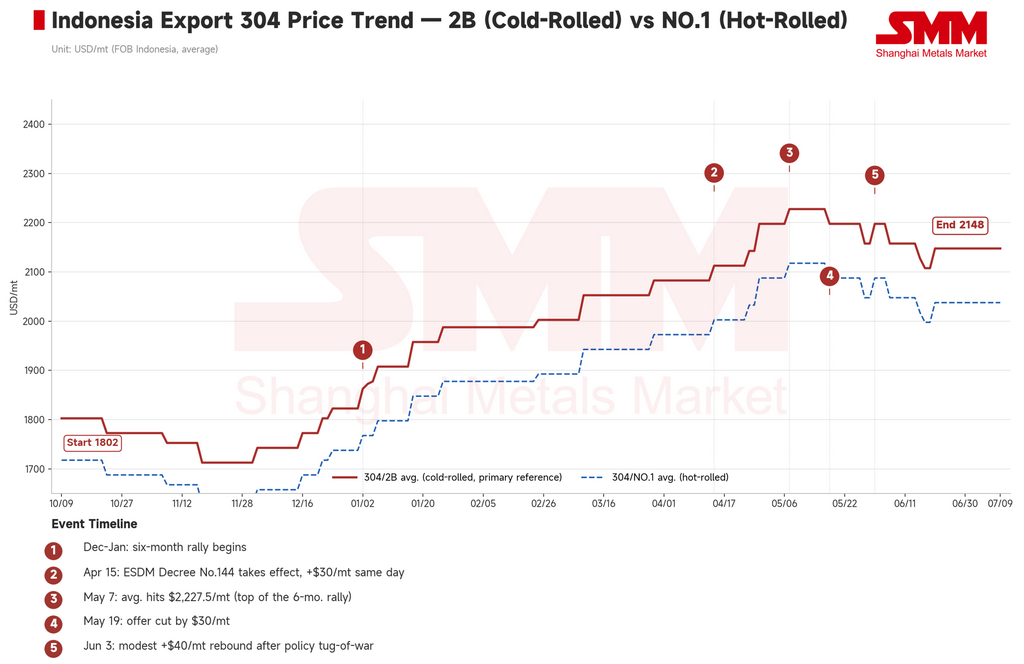
The first half of 2026 is done, and the headline number is simple: prices rose almost everywhere. Indonesian export cold-rolled 304 climbed from about 1863USD/ton in late January to a May peak near 2228USD/ton, a gain of more than 360USD/ton over six months. European cold-rolled coil rose steadily from a Q1 average of roughly 2425USD/ton to about 2591USD/ton by the end of Q2. Chinese Taiwanese mills pushed through six straight monthly price hikes, sending domestic 304 cold-rolled back above 70,500NTD/ton — a near three-year high.
But ask which of these markets rose because demand actually got better, and the answer is none of them.
Southeast Asian buyers kept to hand-to-mouth purchasing, with the weakest sales often landing in the weeks with the highest quotes. Taiwan's rally came alongside a 10.4% month-on-month drop in exports. European restocking was concentrated among traders, not end users, whose consumption stayed weak. Prices went up. Demand didn't. That's the core contradiction defining overseas stainless steel in H1 2026: policy and cost pushed prices higher, while demand never caught up.
I. Indonesia raises the cost floor: three policy moves reprice the whole chain
The most consequential development of H1 wasn't any single price move — it was Indonesia systematically raising its own production cost floor, through three linked policy actions.
First, tighter ore quotas. Indonesia's 2026 RKAB base quota for nickel ore was cut to 260 million wet metric tons, down from roughly 379 million wet tons actually approved in 2025, tightening raw-material supply expectations.
Second, a change to ore pricing rules. Ministerial Decree No. 144, issued by Indonesia's Ministry of Energy and Mineral Resources (ESDM) and effective April 15, raised the price-correction factor for 1.6%-grade nickel ore from 17% to 30%, while bringing cobalt, iron, and chromium by-products into an independent pricing system for the first time. Together, these changes lifted comprehensive Nickel Pig Iron (NPI) production costs by an estimated 2.55%.
Third, a freeze on new capacity. Regulation PP 28/2025 froze approvals for new NPI production lines, formally constraining Indonesia's ability to expand smelting capacity.
Less ore, no new furnaces, and part of existing capacity now diverted to battery-material supply chains — together, these three constraints have shifted the central question in Indonesian nickel supply from "how much can be produced" to "how much will policy allow."
The effect on stainless steel was direct. Indonesian export 304 prices rose 60–70USD/ton in some months, climbing for six straight months from December 2025 through May 2026 and lifting the overall export cost curve by roughly 100–180USD/ton. Over the same period, the 304/316L spread widened to about 2100USD/ton, a year-to-date high — reflecting both tight global molybdenum concentrate supply and independent demand support for 316-grade material from aerospace and other high-end applications. A major Indonesian nickel mine also announced a maintenance shutdown starting in May, adding further pressure to ore supply and reinforcing NPI price support.
Who's paying for this higher cost curve? Not Indonesia — every downstream market that needs nickel units is.
II. Southeast Asia: prices without a market, and a rally that ends in a cut
From January through May, Indonesian mills raised prices almost every month, and each pause in quoting hinted at another increase to come. Buyers in Vietnam, Malaysia, and Thailand responded by waiting — hand-to-mouth restocking across the board, with the weakest sales landing in the weeks with the highest quotes. Malaysian domestic 304 cold-rolled coil held in a range of MYR 8950–9415/ton, but actual order flow consistently lagged behind the pace of price hikes.
On May 19, that pattern broke.
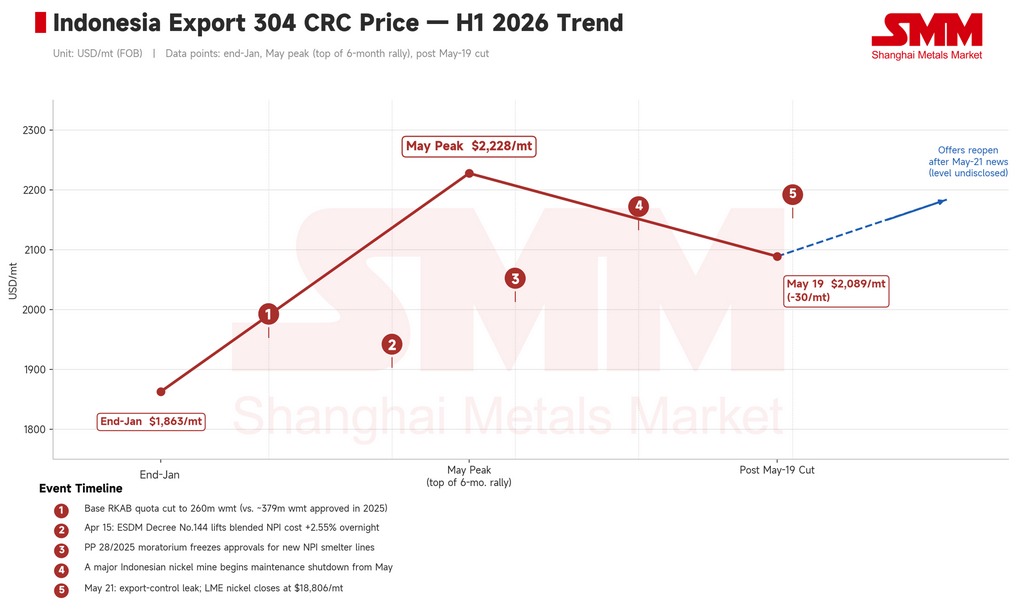
Leading Indonesian mills cut their FOB 304 export offer by 30USD/ton, from about USD2228 back to roughly USD2089, ending the six-month rally. This wasn't demand improving — it was accumulated buyer resistance hitting a breaking point, compounded by easing expectations of a sulfur supply crisis as regional tensions cooled.
Sentiment then reversed within days. On May 21, details leaked from an Indonesian Ministry of Trade coordination meeting: ferroalloys, including NPI (HS code 7202.60.00), would be brought under a state-owned export control framework, with PT Danantara Sumberdaya Indonesia designated as the sole export entity. A transition period was set to start June 1, with full implementation planned from January 2027.
The news flipped market sentiment almost overnight, from "wait for prices to fall further" to "lock in cargo before controls take full effect." LME nickel closed that day at 18,806USD/ton, and Southeast Asian mills quickly reopened quoting. It was the sharpest two-day sentiment swing of the half — and a clear sign that current pricing is driven more by policy expectations than by real demand.
Vietnam saw its own separate shift. On April 17, a provisional Vietnamese anti-dumping duty of up to 27.83% on Chinese mainland hot-rolled coil took effect, ending the pre-tariff restocking rush. Vietnamese processors have since been shifting sourcing away from mainland China toward Taiwan Province, South Korea, and Indonesian raw materials, reshaping regional feedstock cost structures.
III. Taiwan, China: six price hikes are a pricing strategy win, not a demand win
Taiwan's first half comes down to two numbers: six straight monthly price increases, and a 10.4% drop in exports.
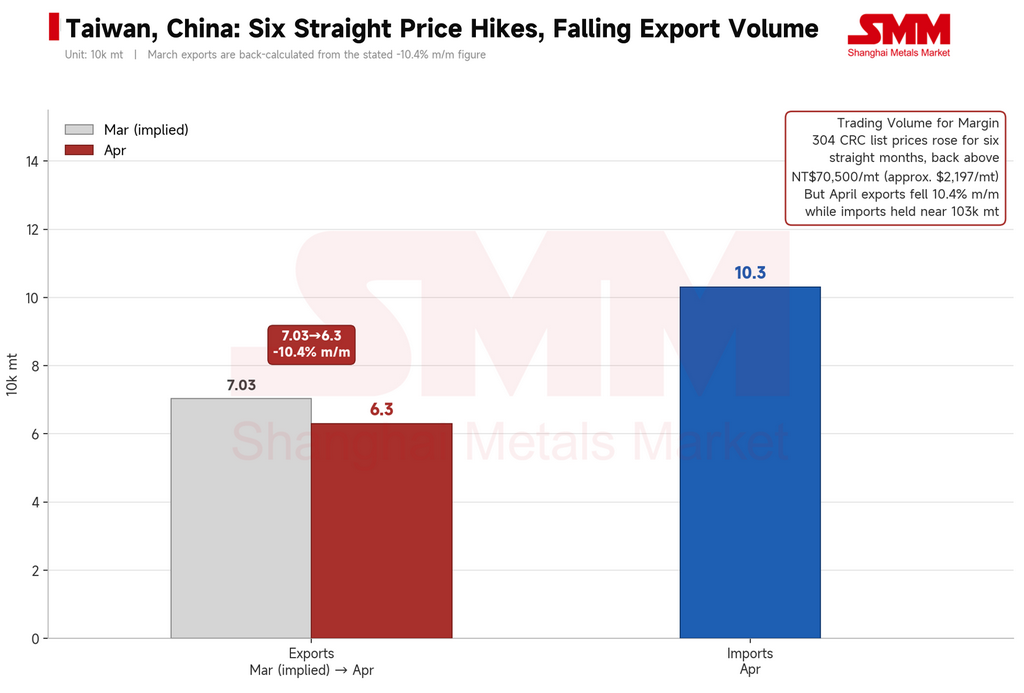
Domestic 304 cold-rolled mill prices rose for six consecutive months, into a range of 69,300–74,000NTD/mt, the highest level in nearly three years. Trade data tells a different story: Taiwan's stainless steel exports fell to roughly 63,000 mt in April, down 10.4% month-on-month, while imports held near 103,000 mt with average import prices continuing to slide. In other words, domestic mills held prices firm while cheaper imported material kept flowing in.
Firm prices alongside weak sales — that's Chinese Taiwan's underlying condition through H1. This wasn't expanding demand. It was mills deliberately cutting volume and holding output down to protect margins.
IV. Europe: policy in the driver's seat, demand along for the ride
Europe's rally worked differently than Asia's — not purely cost-driven, and not demand-pulled, but lifted by policy.
Starting January 1, 2026, the EU's Carbon Border Adjustment Mechanism (CBAM) entered its substantive compliance phase. Current estimates put the added cost at roughly €80/ton for cold-rolled 304, with higher-carbon production routes potentially facing default charges above €140/ton. As landed costs for Asian material approach domestic European price levels, the traditional import discount is disappearing structurally.
At the same time, new Tariff Rate Quota (TRQ) rules reached political agreement on April 14 and took formal effect July 1. Under the new system, the EU's overall steel import quota was cut by roughly 47%, and the over-quota tariff doubled from 25% to 50%. Once this became known, European traders moved quickly into precautionary restocking, producing an unusual counter-seasonal inventory build; some mills closed their June order books early.
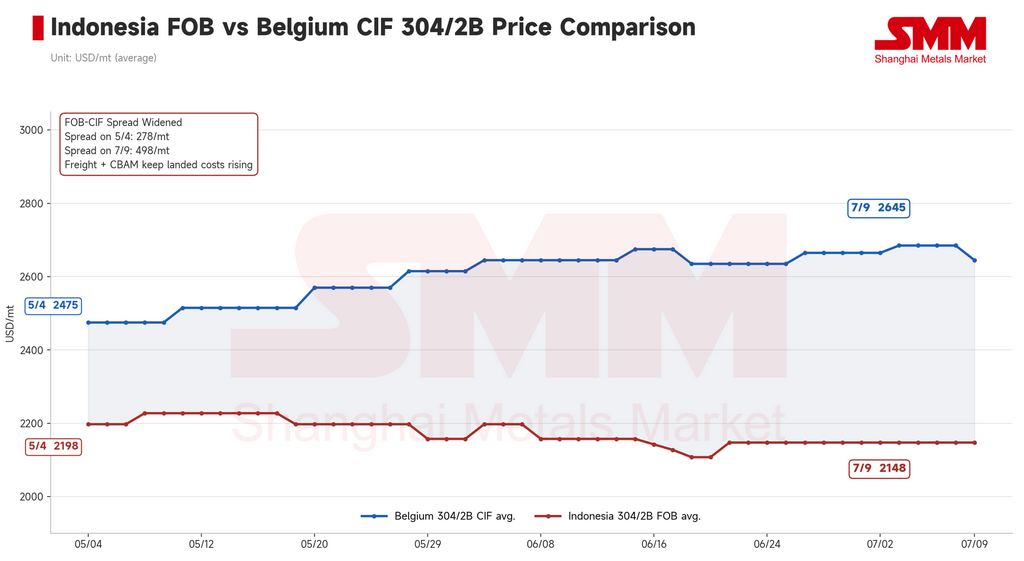
European CIF cold-rolled 304 prices moved into a range of €2550–2740/ton, with some mills targeting as high as €2900/ton by the end of Q3 2026. Yet end-user consumption has stayed weak throughout. This rally reflects traders buying ahead of the post-July 1 tariff increase, not a real demand recovery — tighter policy simply reduced the flow of cheap imports, giving domestic mills more room to hold prices firm even without stronger underlying orders.
On June 29, just before the new rules took effect, the European Commission issued Regulation (EU) 2026/1457, finalizing country-specific quota allocations.
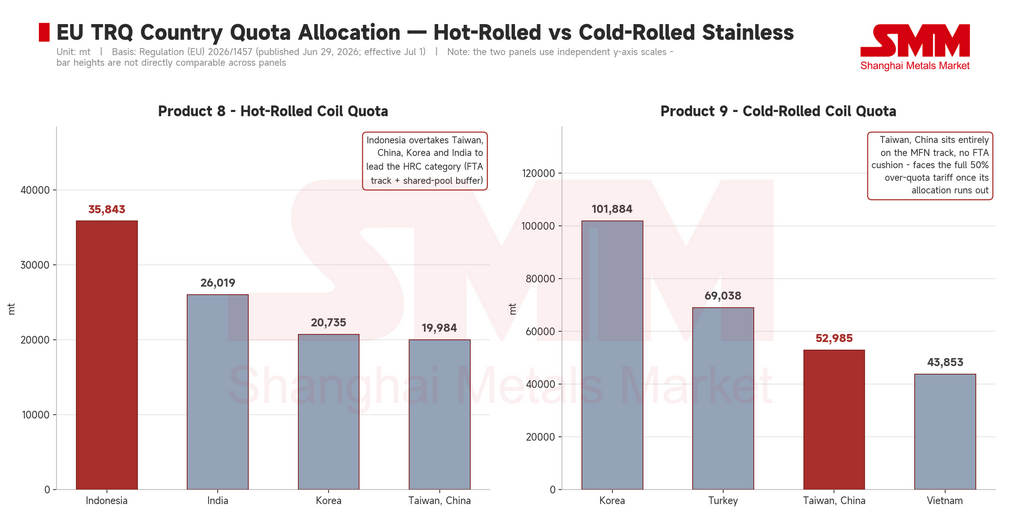
For cold-rolled stainless (Product 9), South Korea topped the list with 101,884 mt, with a dual MFN-plus-FTA pathway and access to a shared buffer pool. Taiwan ranked third with 52,985 mt, but its allocation sits entirely on the MFN track, with no FTA buffer, and under Annex II Section 3 it's barred from drawing on any residual quota. In practice, once Taiwan's dedicated allocation runs out, its exporters face the full 50% over-quota tariff immediately. Same quota, very different terms — one is a renewable pass, the other closer to a one-time ticket.
For hot-rolled stainless (Product 8), the biggest surprise was Indonesia topping the list with 35,843 mt — ahead of Taiwan (19,984 mt), South Korea (20,735 mt), and India (26,019 mt) — with FTA access to the shared buffer pool as well. That overturns the earlier market assumption that Indonesia mainly supplies slab to third countries like Vietnam and Turkey for further processing; it's now clearly a major direct source of EU hot-rolled stainless imports in its own right.
For long products and tube, India stands out furthest: it leads every category, with quotas of 92,557 mt for bar, 18,772 mt for wire, and 15,329 mt for seamless tube.
But the real test of these allocations is the melt-and-pour origin declaration requirement, mandatory from October 1. Quotas decide who gets in the door; melt-and-pour rules ask the harder question — whose material is this, really? Vietnam (43,853 mt) and Turkey (69,038 mt) both hold sizeable cold-rolled quotas, but a meaningful share of their export chains depends on Indonesian slab or semi-finished input. From October, whether they can produce complete, clear origin documentation acceptable to EU customs will decide whether these quotas are real market access — or access with strings attached.
V. The United States: an island market, but nobody on the island feels the price
The US first half comes down to two numbers: imports down 16.3%, domestic output up 7.7%.
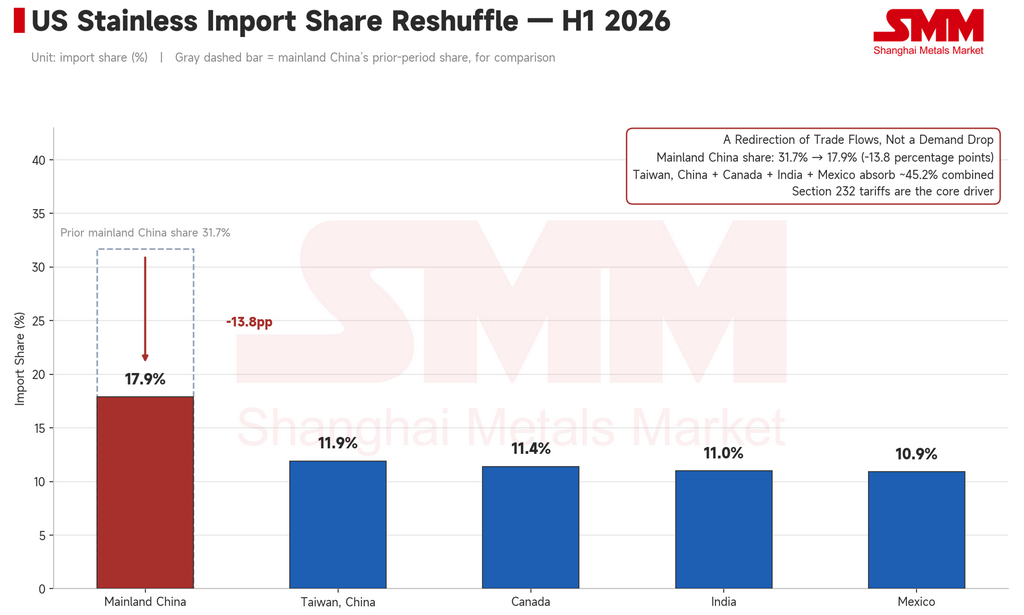
Mainland China's share of US stainless steel imports fell from 31.7% to 17.9%, with the gap absorbed by Taiwan (11.9%), Canada (11.4%), India (11.0%), and Mexico (10.9%). This isn't shrinking demand — it's a redirection of trade flows. Section 232 tariffs have shut out lower-cost sources, and domestic US producers have filled the gap, strengthening the pricing power of the domestic supply chain.
By 2030, the US stainless steel price index is projected to rise roughly 48% above its 2023 baseline — the largest and most clearly realized gain of the four major markets. The EU is projected to rise about 19% over the same period, with CBAM cost pass-through lagging by one to two years.
US and EU price premiums reflect different mechanisms. The US premium is a tariff wall, and its repricing has largely already happened. The EU premium is carbon costs and quota rules working through the system more gradually — slower, but with more staying power. Living on a tariff-protected island costs more. But the cost is clear, and it's stable.
Outlook: three open questions for H2
Three policy gates tightened in tandem through H1 2026. The question for the second half is whether they keep closing.
First, does India's import window stay open?
India's exemption from its Quality Control Order (QCO) for stainless imports has been extended to March 31, 2027, so no mandatory certification barrier is coming in the near term. At the same time, India's smaller domestic producers are pushing hard for the government to reinstate strict import quality controls to curb cheap imports. India eased related rules in late 2025 to address grade-specific shortages, and the effect showed up fast: April 2026 imports hit 101,252 mt, up 65% year-on-year, with Chinese finished-steel exports to India roughly doubling from a year earlier, a near two-year high. The window looks likely to stay open in the near term, potentially fueling a Q3 restocking wave — but rising domestic pressure to reinstate QCO means that's not guaranteed. Any reversal, especially combined with new anti-dumping measures, would be the single biggest downside risk for overseas stainless steel in H2, and a real test of whether H1's cost increases can actually be absorbed downstream.
Second, how fast will EU quotas be drawn down in Q3?
July 1 through September 30 is the first full observation window under the EU's new TRQ regime. How quickly the three key allocations — Korean cold-rolled, Indonesian hot-rolled, and Taiwanese cold-rolled — get consumed will directly shape European price direction. Fast drawdown would likely push buyers to lock in Q4 supply early, lifting import premiums and domestic prices together. Slow drawdown would suggest CBAM costs, compliance burden, and weak demand are already suppressing imports, meaning any further price gains reflect cost support rather than real demand pull. September 30 is the first real checkpoint for how much of this policy tightening converts into actual price pressure.
Third, how strictly will Indonesia enforce its export controls?
The transition period for Indonesia's ferroalloy export controls formally began June 1, but there's still no clear official ruling on whether existing long-term contracts will be exempted. That uncertainty alone is already raising compliance costs and delaying purchasing decisions. Smooth implementation could see Indonesian export prices climb back above $2,200/mt after the earlier pullback; unclear rules or friction in execution could trigger a correction in the bullish policy expectations built up over H1.
Conclusion
Three markets, three different mechanisms, one shared direction: Indonesia is closing the door on supply, the EU is closing the door on imports, and the US shut its door three years ago. Prices are rising through the gaps in these doors — not because demand has arrived, but because the paths into these markets keep narrowing. Heading into H2 2026, the real question isn't whether demand will suddenly strengthen. It's whether these three gates keep closing further. If they do, what's being traded in overseas stainless steel markets is no longer just supply and demand — it's the right of access itself.
Southeast Asian buyers stuck to hand-to-mouth purchasing, with the weakest sales often falling in the weeks when quotes were highest. Taiwan's six-month rally coincided with a 10.4% month-on-month drop in April exports, while imports stayed elevated. In Europe, restocking was concentrated among traders positioning ahead of new rules — not a recovery in real consumer demand. Prices moved up. Demand didn't follow. That gap is the defining story of overseas stainless steel markets in the first half of 2026.

![[SMM Nickel Midday Review] On July 10, nickel prices staged a corrective rebound, and the national consumer price index rose 1.0% YoY in June.](https://imgqn.smm.cn/usercenter/UruWE20251217171732.jpg)