I. Price Trends: Drifted Lower in H1, Hit Bottom Faster in June
In H1, solar cell prices went through three phases: “consolidating at highs, rapid pullback, and accelerated deep declines.” Price trends for the three mainstream TOPCon solar cell specifications were highly synchronized, with an overall drop of about 35%–39%.
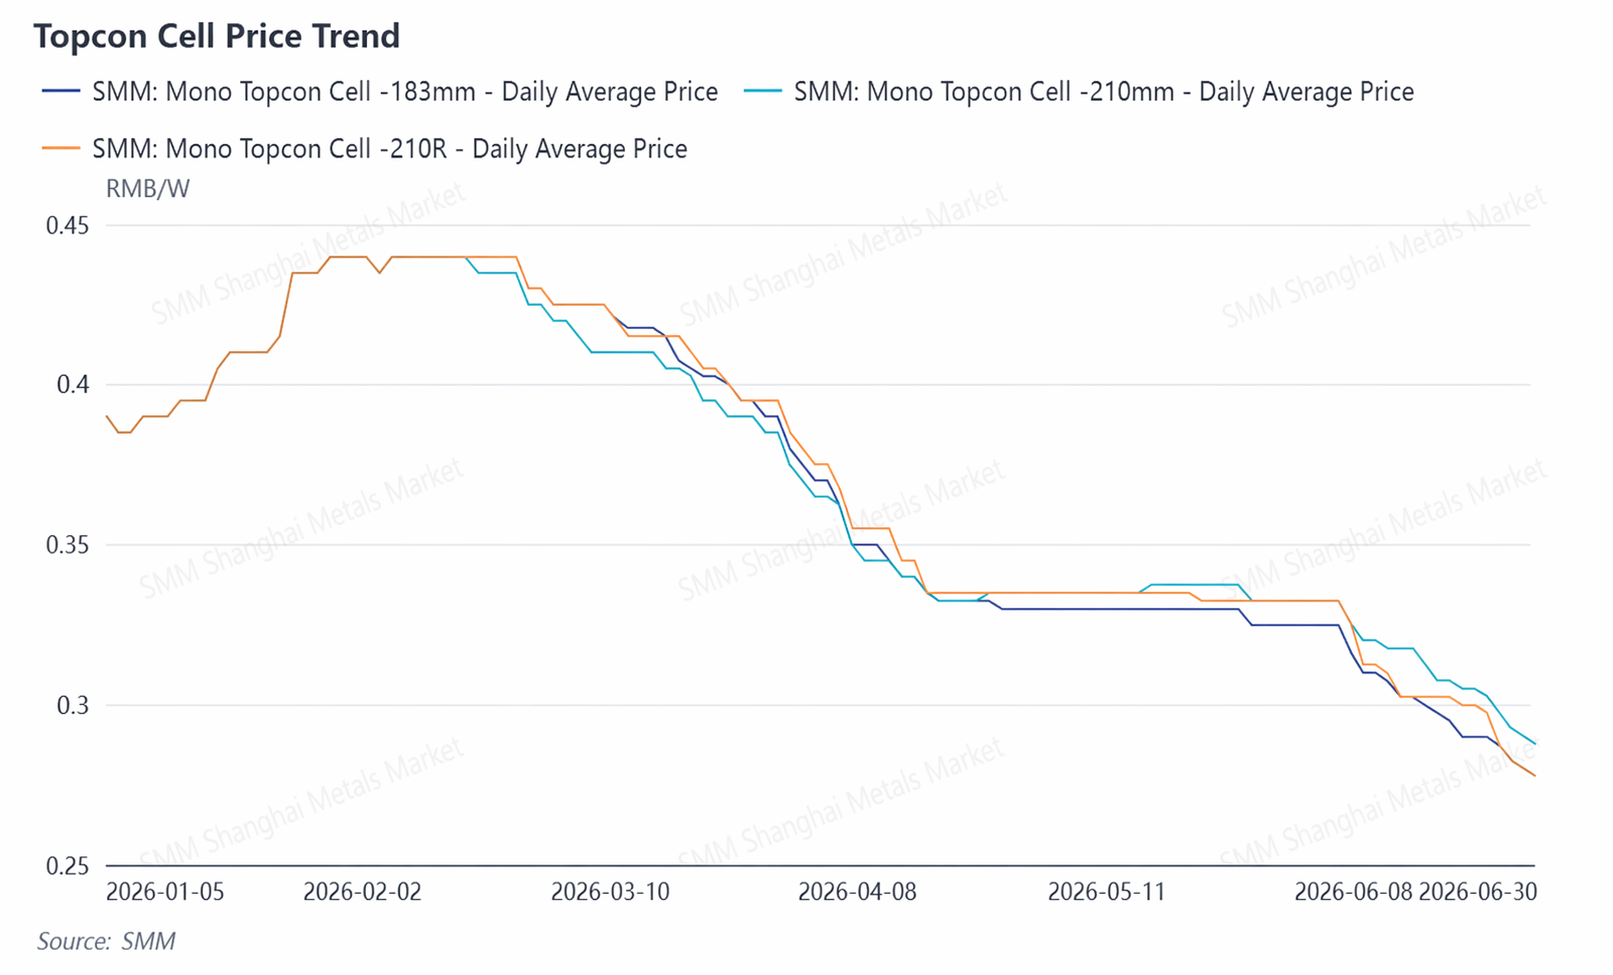
From January 2026 to February 2026: Consolidated at highs.At the beginning of the year, a sharp surge in silver prices drove silver paste costs higher. The TOPCon 183N solar cell price kept rising from 0.39 Yuan/W in early January to 0.44 Yuan/W by month-end, with top-tier producers leading the gains and the transaction center moving up. Around the Chinese New Year, affected by sluggish demand, prices remained in a stalemate at high levels, staying in the 0.435–0.44 Yuan/W range in February.
From March 2026 to April 2026: Rapid pullback.After the holiday, sharp declines in silver prices and wafer prices weakened cost support, and solar cells entered a rapid downward trajectory. In early March, the Topcon 210N solar cell price kept sliding from 0.425 Yuan/W to around 0.3325 Yuan/W by mid-April, a cumulative drop of about 22%. After export tax rebates were officially canceled on April 1, export orders plunged, the solar cell segment entered an inventory buildup phase, and bearish market sentiment intensified.
From May 2026 to June 2026: Accelerated deep declines. In May, mainstream prices briefly stabilized around 0.33 Yuan/W, but after the SNEC exhibition in June, quoted prices and the transaction center moved down markedly. As of July 8, the average price of TOPCon 183N was 0.2675 Yuan/W, 210N was 0.2775 Yuan/W, and 210R was 0.2675 Yuan/W.
II. Production and Operating Rates: Proactive Contraction in H1, Production Schedule Stabilized and Rebounded in June
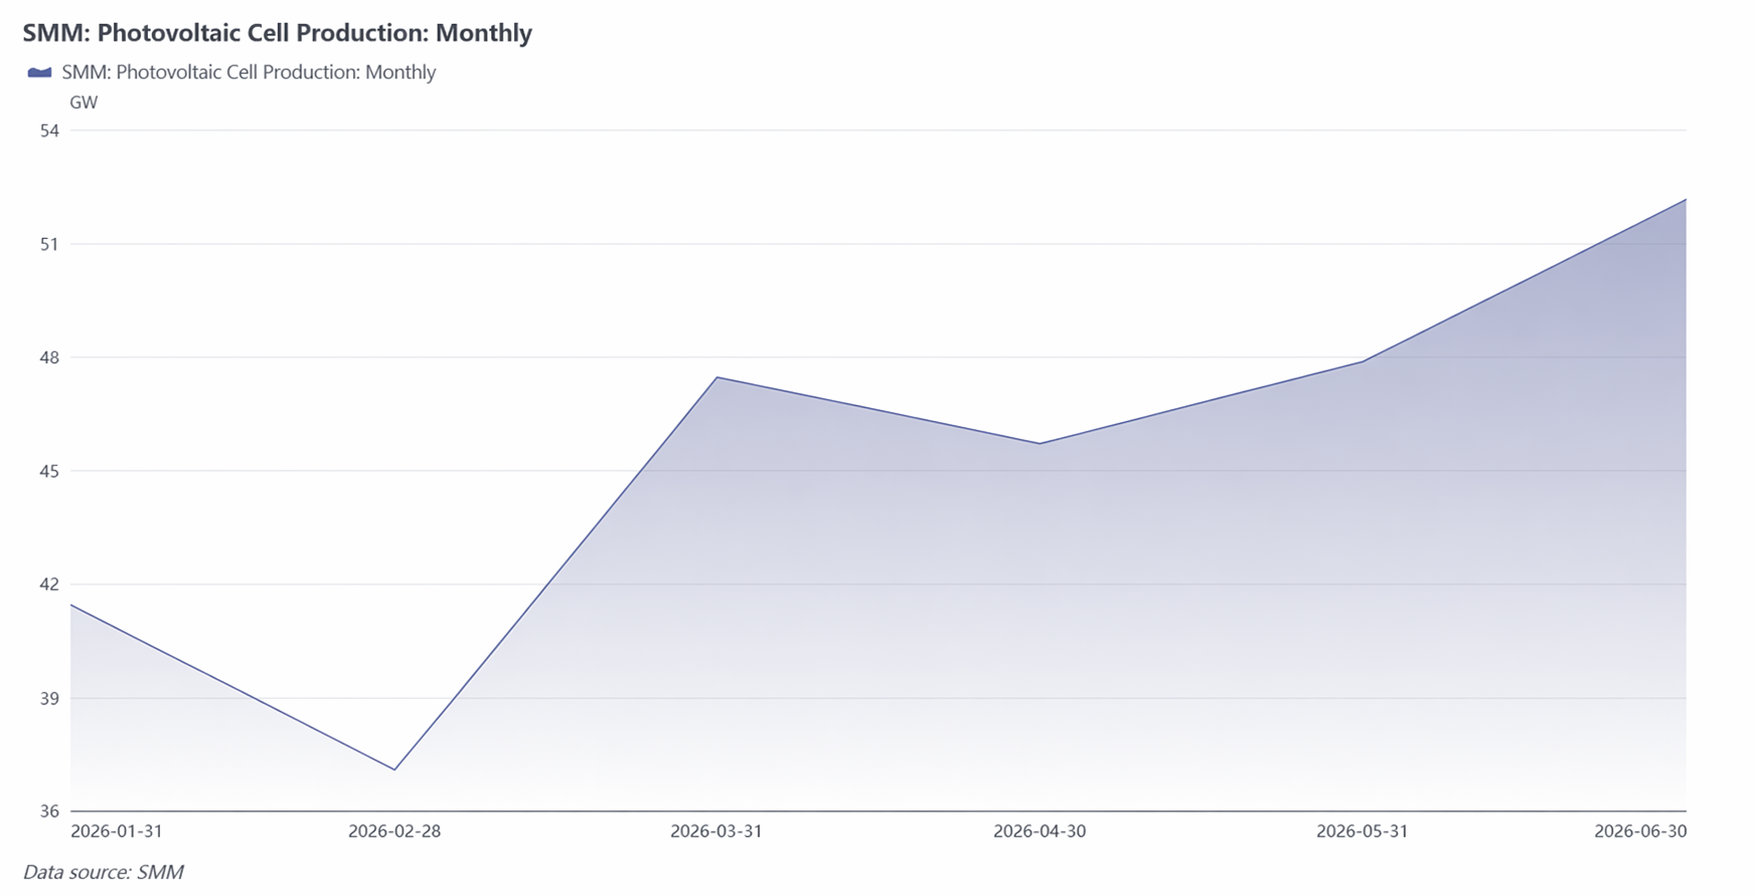
Overall solar cell production in H1 fell by nearly 20% YoY, as the industry proactively contracted after the capacity boom from 2024 to 2025. The trend showed a “down first, up later” pattern, but the rebound was not driven by a recovery in demand. Key turning points occurred in March and April. Production jumped sharply MoM in March, mainly driven by a concentrated rush to deliver ahead of the April 1 cancellation of export tax rebates, rather than by genuine domestic demand. After the rebates were officially canceled, exports plunged from April to May and inventory accumulated rapidly, forcing enterprises to proactively cut production schedules. Although June production rebounded to the H1 high, downstream module growth was clearly slower than solar cell growth, and the incremental output was more converted into inventory.
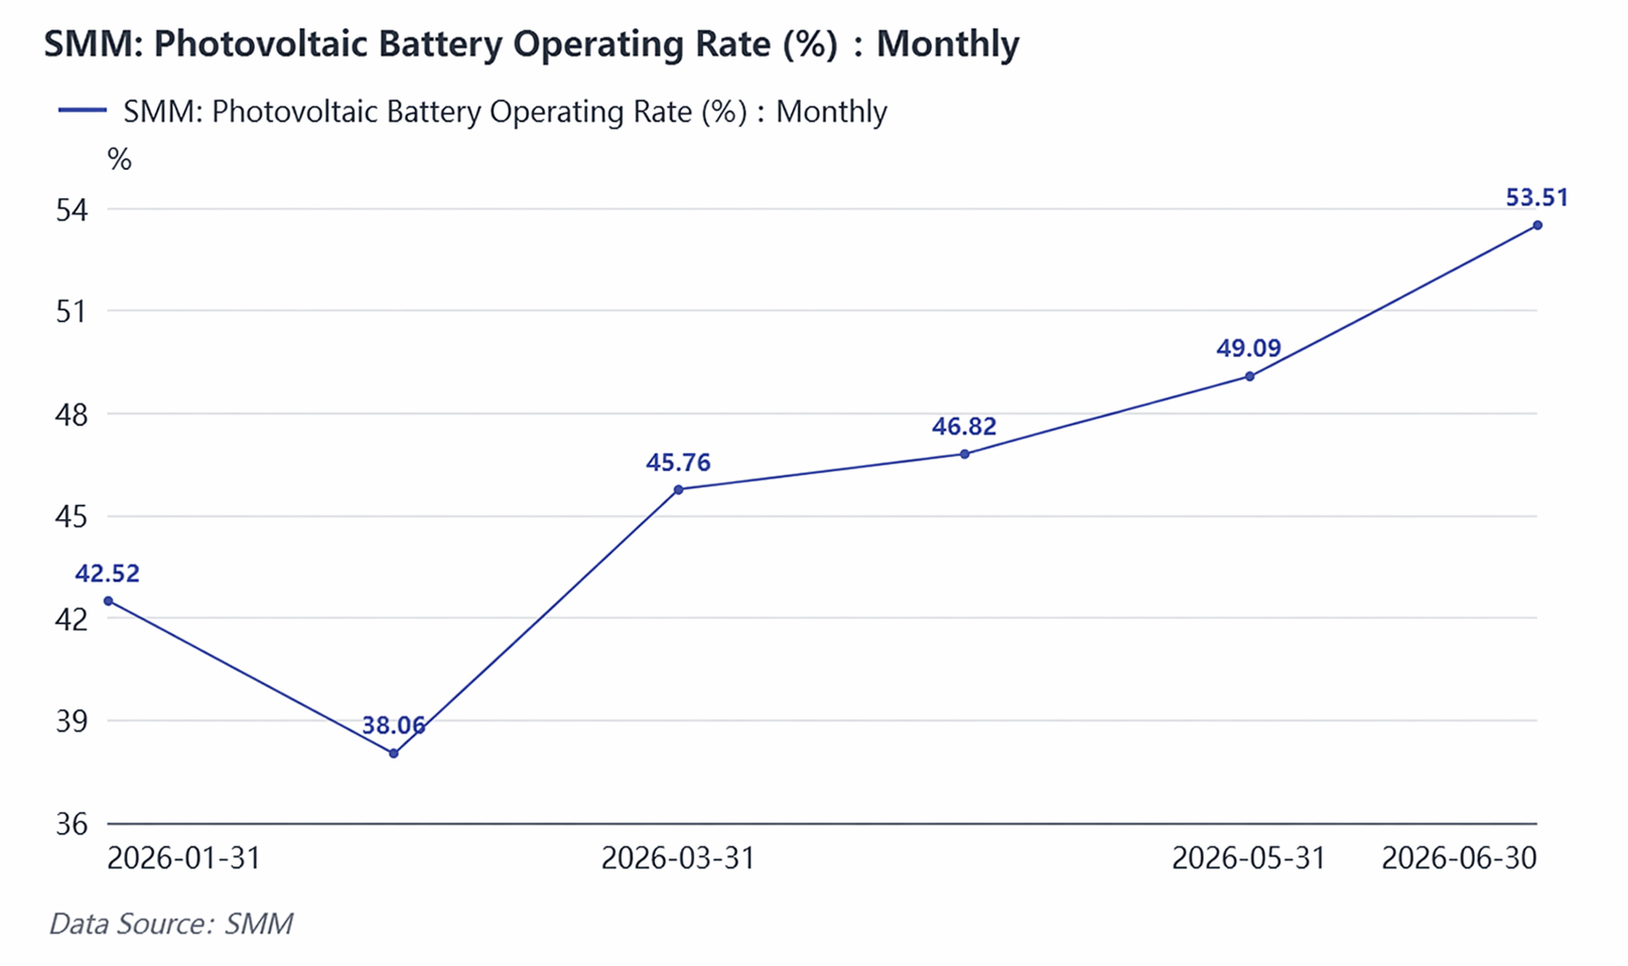
Operating rate data further confirmed structural surplus. In H1, the operating rate rebounded from the February low of 38.06% to 53.51% in June, and is expected to rise to 58.35% in July. While it appeared to improve month by month, it still lagged well behind the 60%–70% level in the same period of 2025. Even with production schedules rebounding, about 50%–60% of capacity remained idle or running at low load. Structurally, high-efficiency TOPCon lines had relatively high operating rates, while PERC and older lines had extremely low operating rates or had already halted production, and the industry’s “two extremes” capacity landscape is becoming entrenched.
Signals of contraction on the capacity side were also clear. On April 29, 29 GW of wafer and cell projects were collectively announced as terminated, including 5 GW of solar cell projects, with originally planned total investment of nearly 4.9 billion yuan. This marked a shift in capital’s stance on PV capacity expansion from aggressive expansion to cautious contraction. New capacity additions were concentrated in high-efficiency routes such as TOPCon upgrades, BC, and HJT, while PERC capacity was accelerating its exit the market. As mandatory performance and efficiency standards are gradually implemented in H2, the pace of low-efficiency capacity exits is expected to accelerate further.
III. Exports: Pre-cancellation Rush Lifted Exports to a Peak, Export Mix Accelerated Diversification
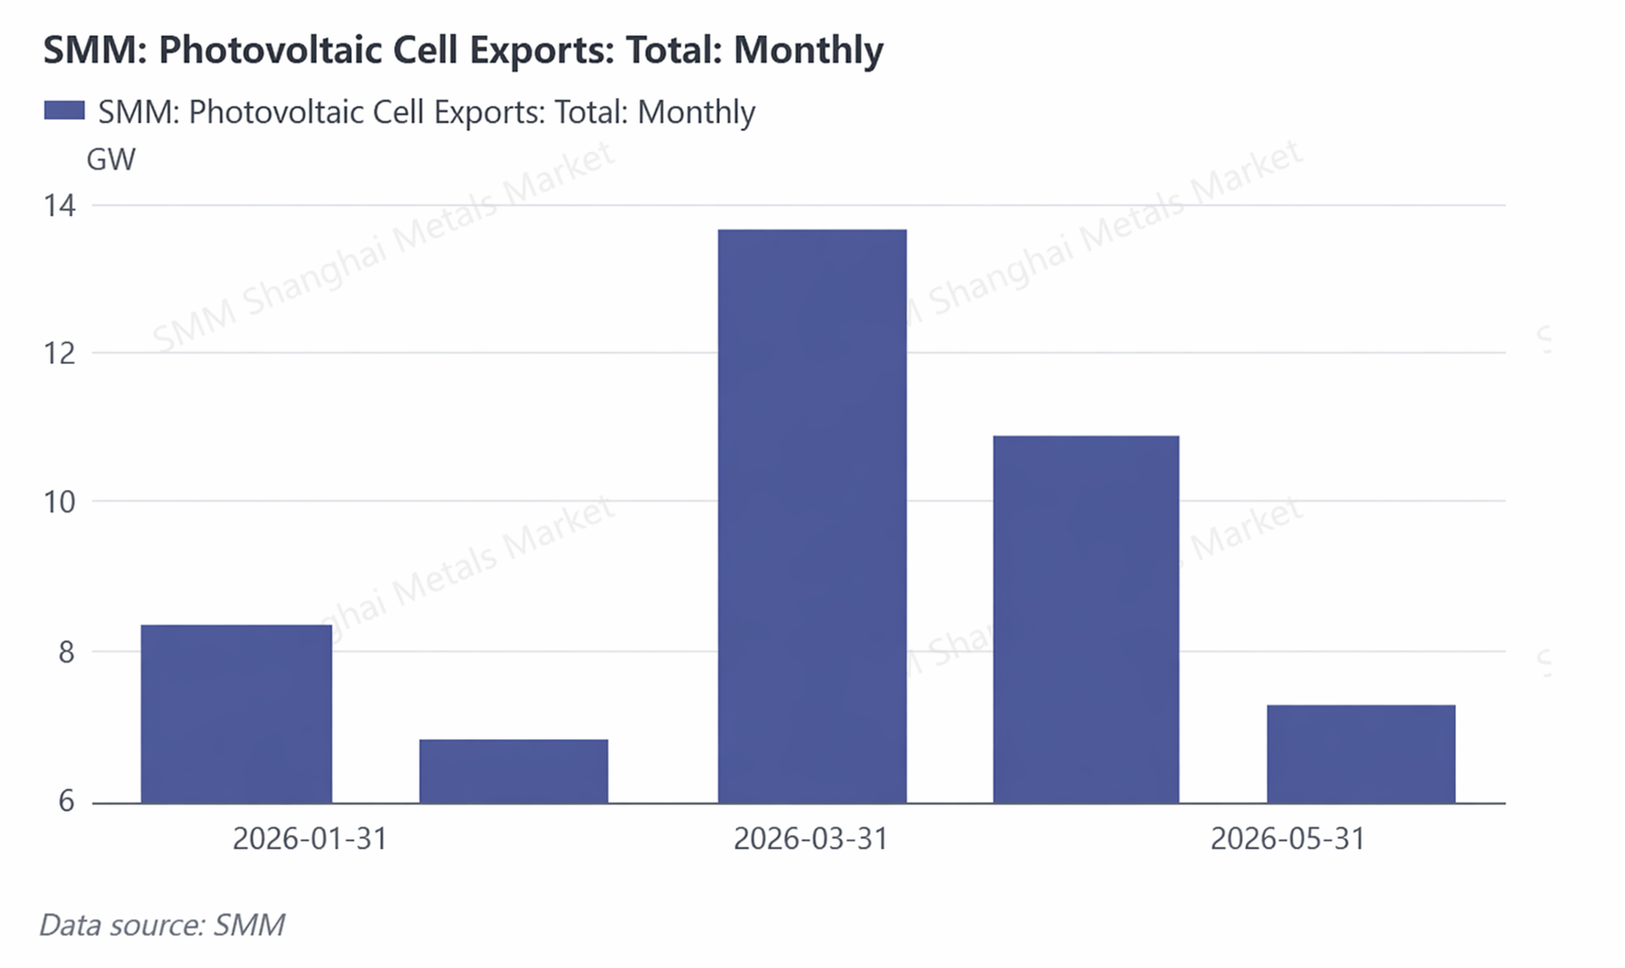
The cancellation of export tax rebates was the policy variable with the greatest impact on the pace of solar cell exports in H1. According to a Ministry of Finance announcement, VAT export tax rebates for PV products were canceled starting April 1, 2026. As a result, exports saw a concentrated rush-shipment peak in March, with SMM-reported monthly exports surging to 13.73 GW, far above the 2025 monthly average. After the rebates were officially canceled in April, exports quickly pulled back to 10.81 GW, down 21.3% MoM; in May, they fell further to 7.34 GW, down 32.1% MoM. Cumulative exports from January to May totaled about 47.13 GW, up about 32% from 35.71 GW in the same period of 2025, indicating that overseas PV installation demand still maintained strong growth momentum. The rebate cancellation did not fundamentally undermine China’s role as a global supply base for solar cells.
Meanwhile, the structure of export destinations is undergoing profound adjustment. According to SMM research, shares in the European and US markets continued to decline, while the proportion of emerging markets such as Indonesia, the Philippines, and Africa rose significantly; Indonesia’s share jumped from 1% to 22%. India’s share of exports continued to shrink, falling to below 50%, mainly because India’s ALMM policy was officially implemented on June 1, with a total listed scale of 29.9 GW, creating a clear barrier to China’s solar cell exports. The globalization strategy of Chinese-funded enterprises is shifting from a single Southeast Asian “springboard” to a “networked localization” production system across the Middle East, North America, and Africa.
IV. Outlook for H2 2026—Key Focus Areas for Prices, Exports, and Policy
On prices, Topcon solar cell prices in H2 are expected to show an overall upward trend, with the pace moving through three phases: “under pressure at highs—phased pullback—stabilization and rebound.” After inventory buildup pressure reaches a phased peak in July, starting in August the peak season for module exports, together with a rebound in export orders, will drive a phased tightening in supply and demand, which may support price stabilization and a rebound; however, upside elasticity will be constrained by the strength of demand repair.
Supply side, mandatory performance and efficiency standards will drive faster capacity exits. MIIT successively issued mandatory national standards such as Safety Requirements for PV Modules and further raised module efficiency thresholds, with minimum efficiency requirements of 23.4% for TOPCon/HJT and 23.7% for BC; estimates indicate a corresponding exit scale of 153–328 GW. Upgrades to module standards will be transmitted upstream to the solar cell segment, and enterprises that took the lead in deploying high-efficiency routes will gain structural advantages during the exit process.
On exports, the rebate cancellation is forcing the industry to shift from “products going global” to “brands going global” and “capacity going global.” After the rebate cancellation, the YoY growth in April cell export value still reached 133.2%, indicating limited short-term impact; however, after the front-loading effect of rush shipments fades in H2, whether enterprises can absorb the rebate shock through outside China capacity deployment will be key. Chinese-funded enterprises’ ex-China capacity is accelerating its expansion from Southeast Asia to the Middle East, North America, and Africa.
![PV Aluminum Extrusion Operating Rate Remains Stable; Middle East Conflict and Aluminum Ingot Destocking Jointly Support Aluminum Prices [SMM Analysis]](https://imgqn.smm.cn/usercenter/FtiwK20251217171741.jpg)
![2026 H1 PV Glass Market Analysis and Outlook — Oversupply Suppresses Prices, Pace of Cold Repair and Market Exit Determines Recovery Space [SMM Analysis]](https://imgqn.smm.cn/usercenter/ZqmSz20251217171738.jpg)
![[SMM PV Flash] Xinjiang's 2027 Mechanism Electricity Price Bidding Announcement: PV 0.259 yuan/kWh](https://imgqn.smm.cn/usercenter/EcOMz20251217171741.jpg)