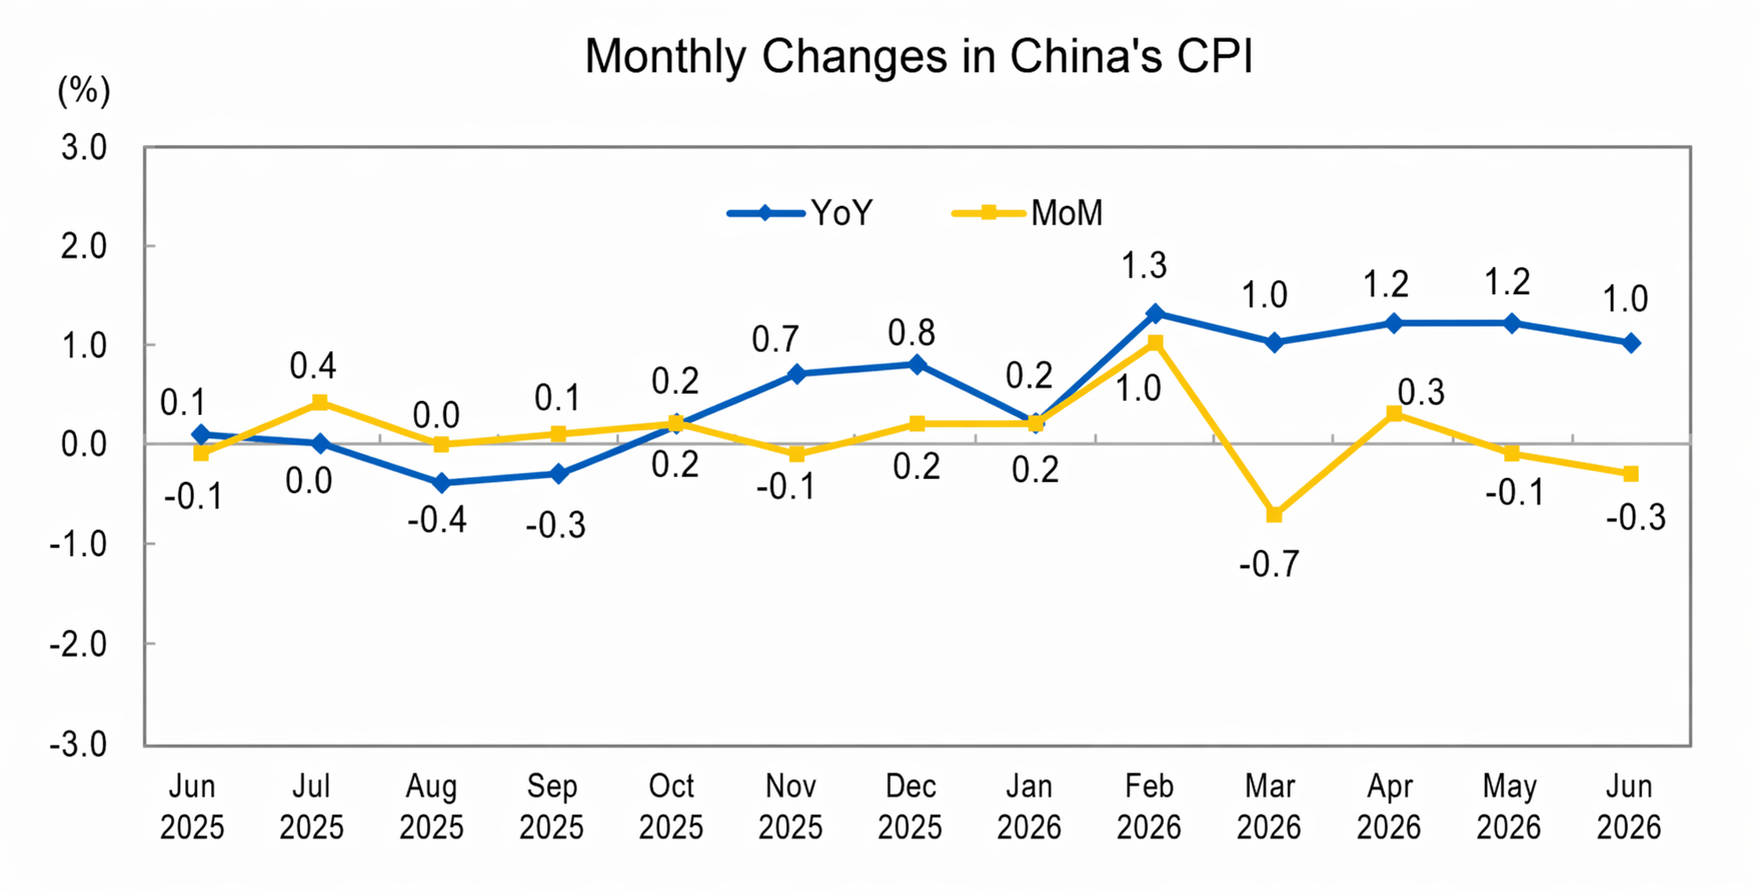
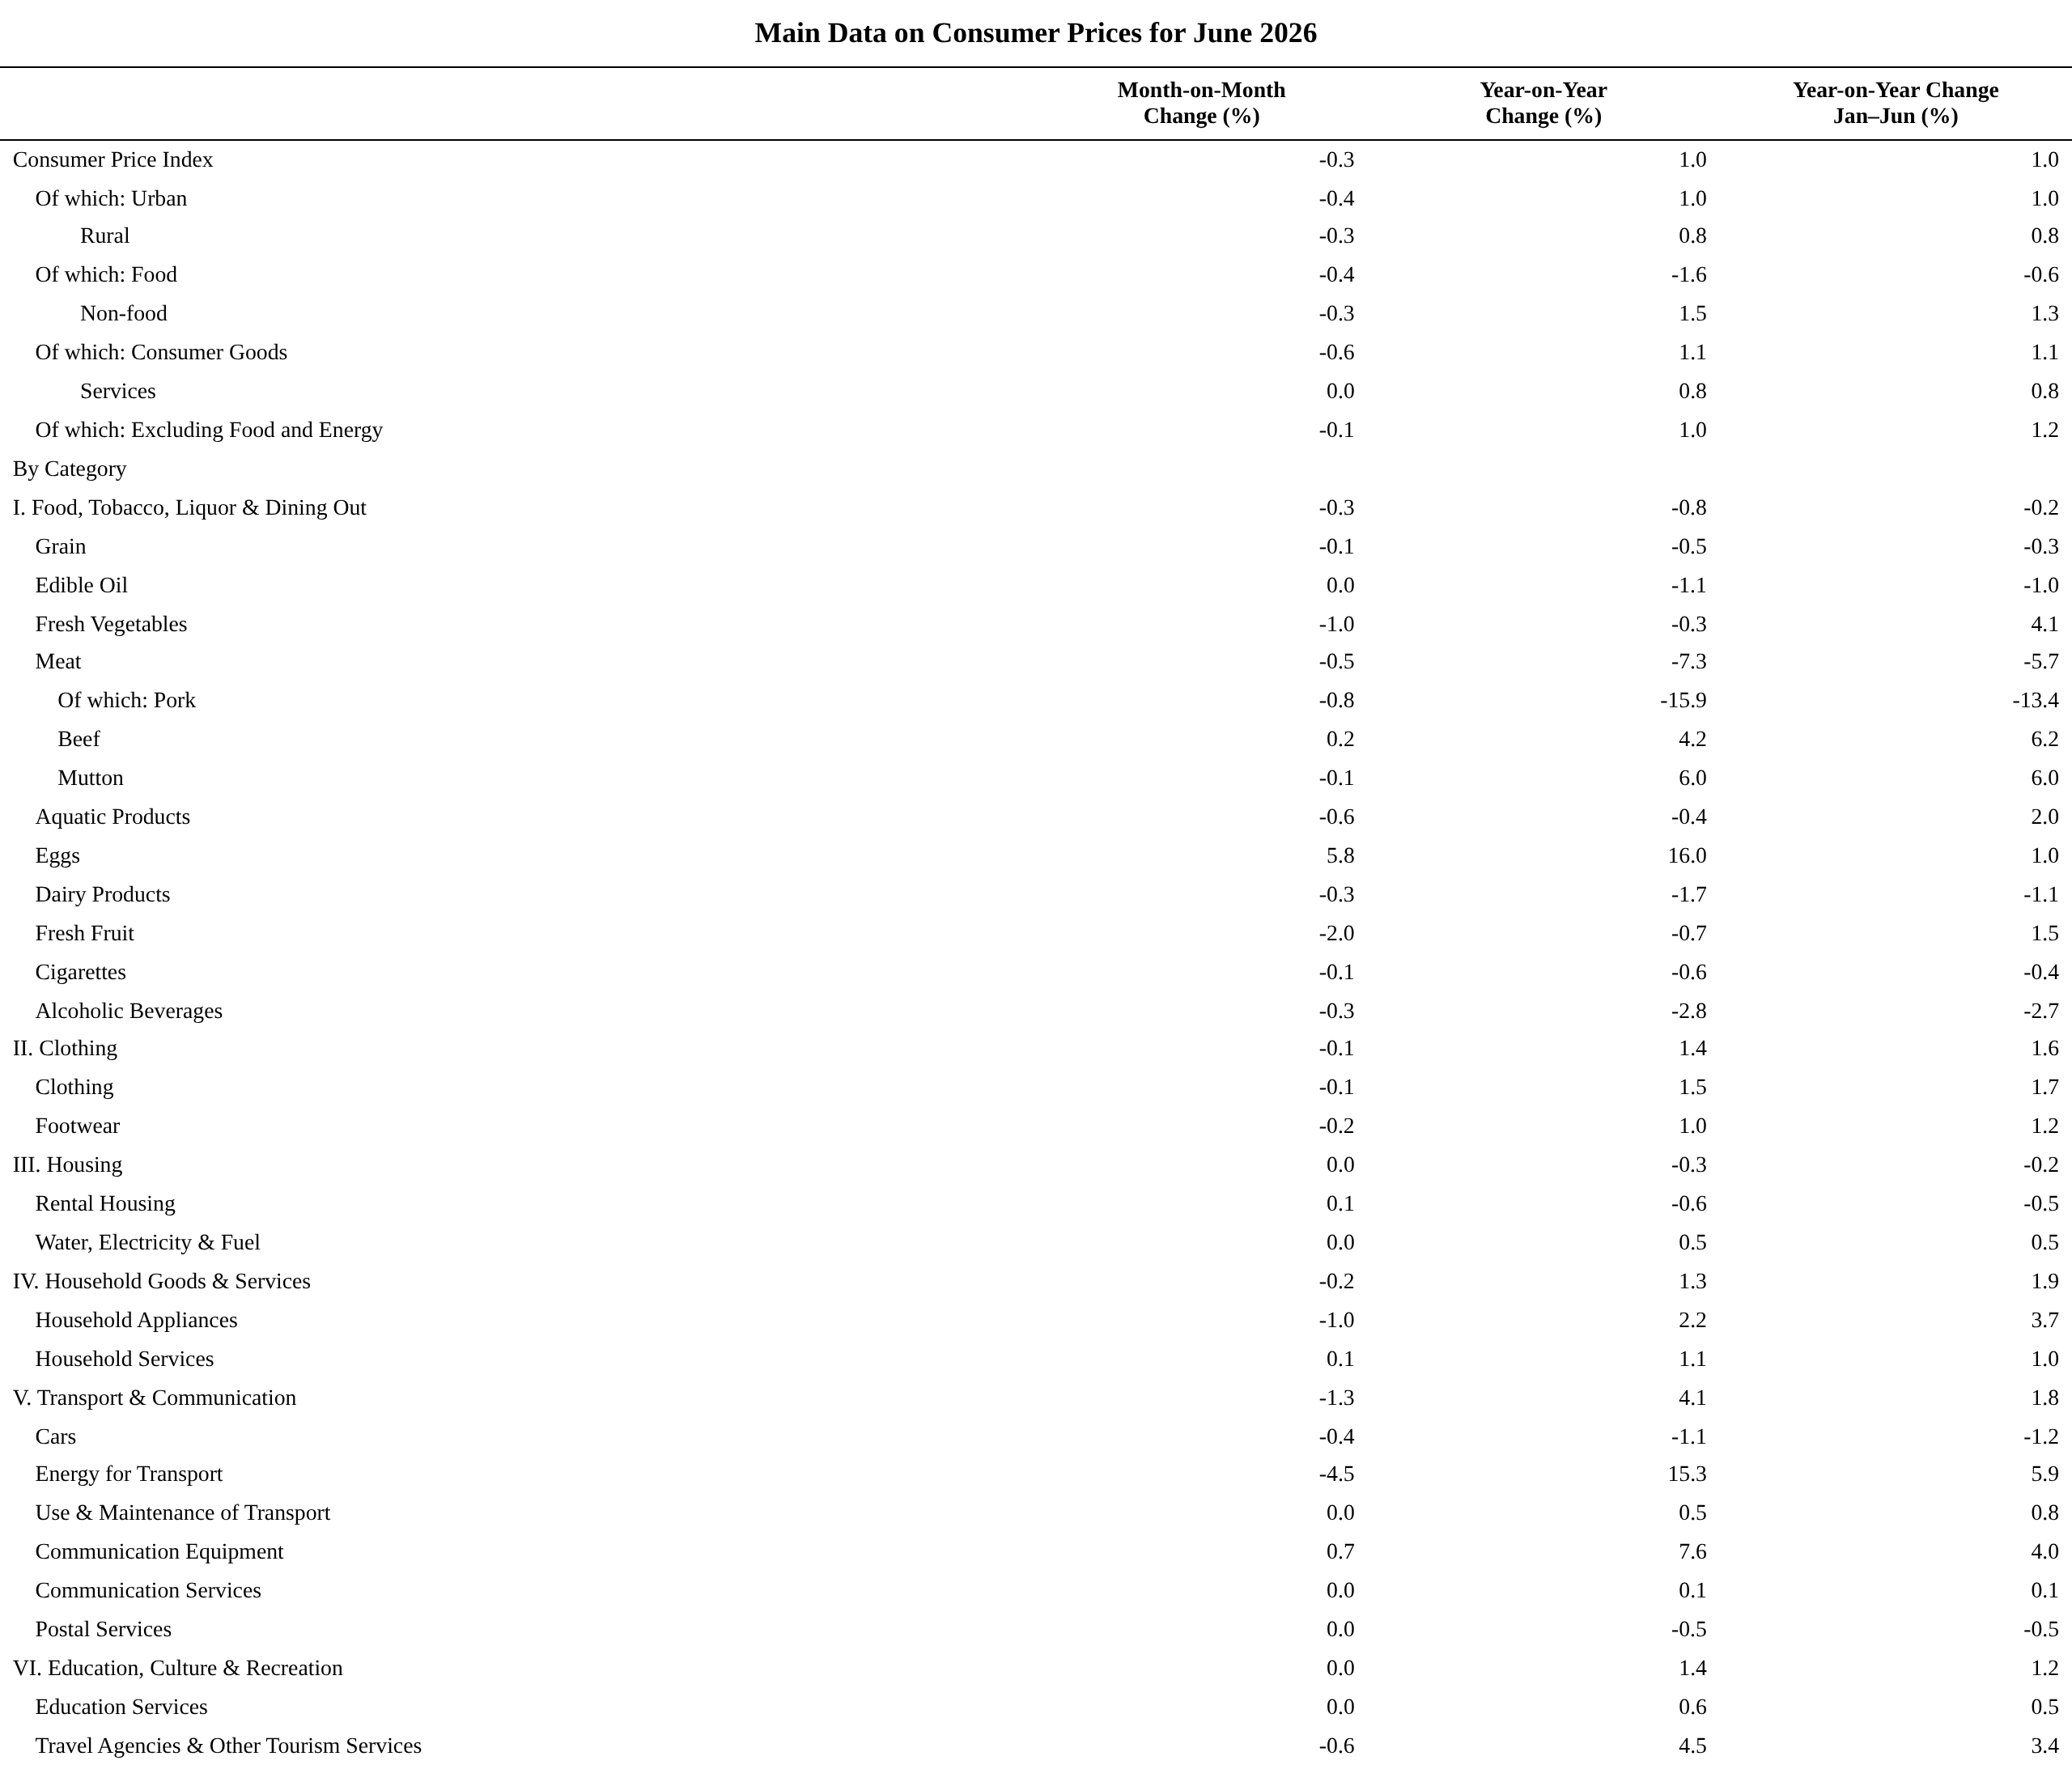
Data from the National Bureau of Statistics (NBS) shows: Data from the NBS shows that in June 2026, the national consumer price index (CPI) rose 1.0% YoY. Specifically, urban areas recorded a 1.0% increase and rural areas a 0.8% increase; food prices fell 1.6%, while non-food prices rose 1.5%; consumer goods prices rose 1.1%, and services prices rose 0.8%. In H1, the national CPI rose 1.0% YoY. In June, the national CPI fell 0.3% MoM, with urban areas down 0.4% and rural areas down 0.3%; food prices fell 0.4%, and non-food prices fell 0.3%; consumer goods prices dropped 0.6%, while services prices remained flat. NBS data also showed that in June 2026, the national industrial producer EXW prices rose 4.1% YoY and fell 0.3% MoM. Industrial producer purchasing prices rose 6.4% YoY and fell 0.2% MoM. In H1, industrial producer EXW prices rose 1.5% YoY and industrial producer purchasing prices rose 2.4% YoY. Dong Lijuan, Chief Statistician of the Urban Survey Department at the NBS, interpreted the CPI and PPI data for June 2026.
In June 2026, CPI Rose 1.0% YoY
In June 2026, the national CPI rose 1.0% YoY. Specifically, urban areas recorded a 1.0% increase and rural areas a 0.8% increase; food prices fell 1.6%, while non-food prices rose 1.5%; consumer goods prices rose 1.1%, and services prices rose 0.8%. In H1, the national CPI rose 1.0% YoY.
In June, the national CPI fell 0.3% MoM, with urban areas down 0.4% and rural areas down 0.3%; food prices fell 0.4%, and non-food prices fell 0.3%; consumer goods prices dropped 0.6%, while services prices remained flat.
1. YoY Changes in Prices of Various Categories of Goods and Services
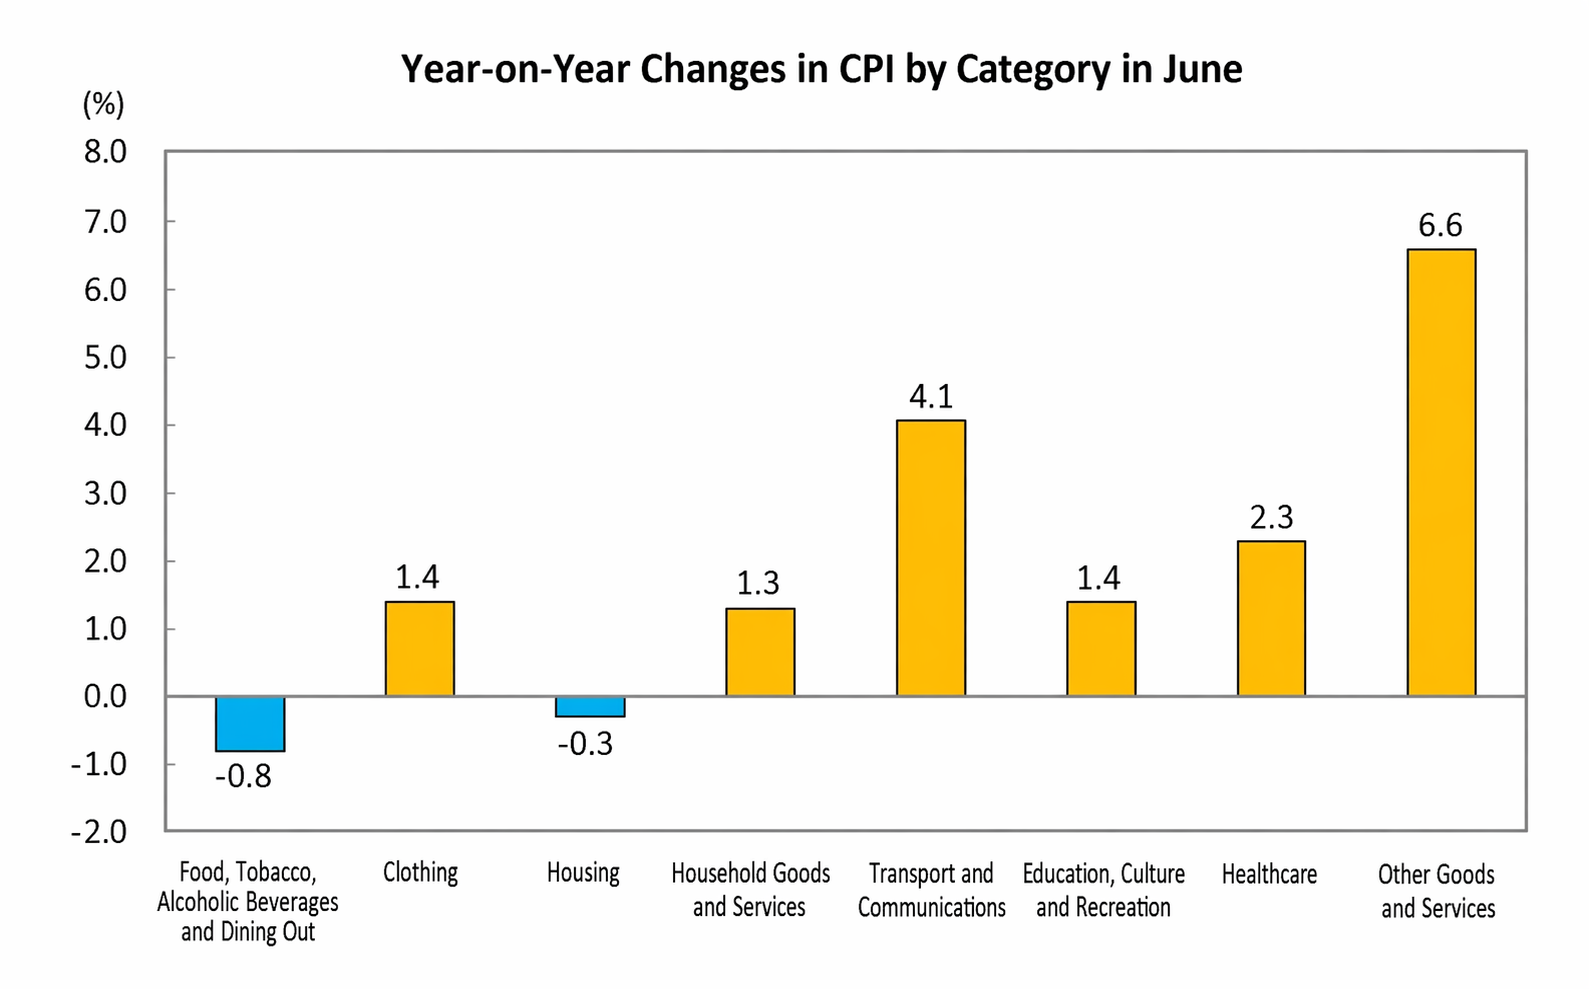
In June, the price of food, tobacco, alcohol and dining out fell 0.8% YoY, dragging the CPI down by approximately 0.24 percentage points. Within food, livestock meat prices fell 7.3%, pulling the CPI down by about 0.30 percentage points, of which pork prices dropped 15.9%; dairy product prices fell 1.7%, contributing a 0.02 percentage point decline in the CPI; fresh fruit prices fell 0.7%, contributing a 0.01 percentage point decline; while egg prices rose 16.0%, lifting the CPI by about 0.08 percentage points.
Among the other seven categories, prices rose YoY for six and fell for one. Among them, prices for other goods and services, transportation and communication, and healthcare rose by 6.6%, 4.1%, and 2.3%, respectively; clothing and education, culture and recreation prices both rose by 1.4%; household goods and services prices rose by 1.3%; and housing prices fell by 0.3%.
II. MoM Changes in Prices of Various Goods and Services
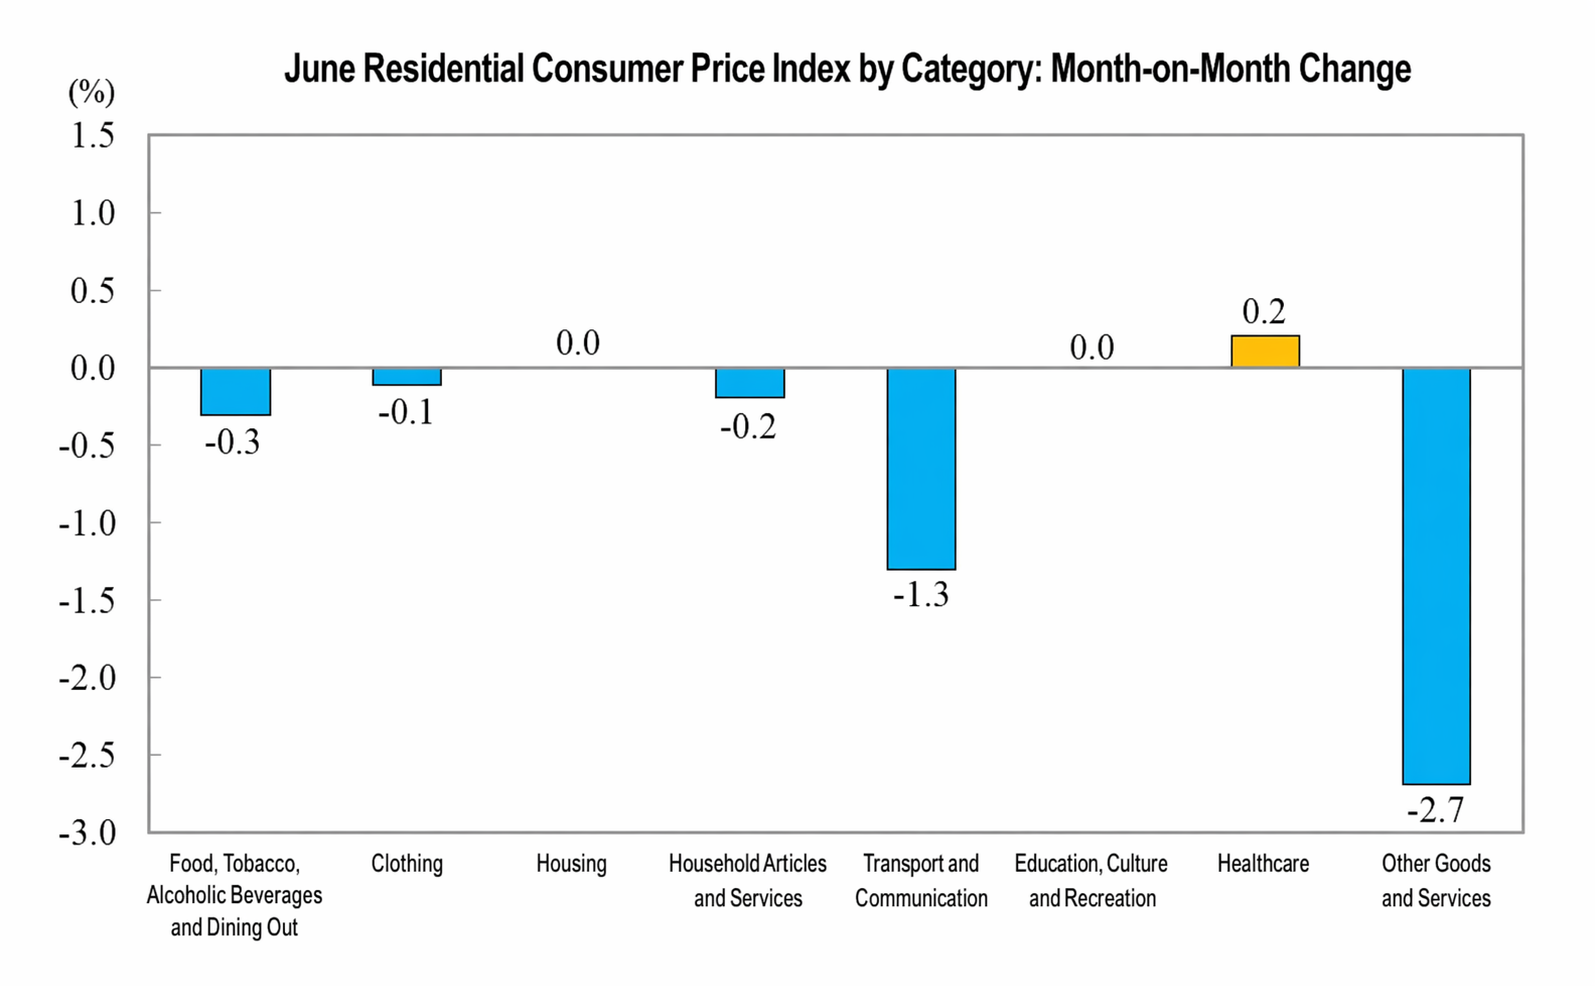
In June, prices for food, tobacco and alcohol, and dining out fell 0.3% MoM, contributing to a decrease of about 0.08 percentage point in the CPI. Within food, fresh fruit prices fell 2.0%, contributing to a 0.04 percentage point decrease; fresh vegetable prices fell 1.0%, contributing to a 0.02 percentage point decrease; livestock meat prices fell 0.5%, contributing to a 0.02 percentage point decrease, of which pork prices fell 0.8%; egg prices rose 5.8%, contributing to a 0.03 percentage point increase.
Prices in the other seven categories showed one increase, two unchanged, and four decreases MoM. Among them, healthcare prices rose 0.2%; housing and education, culture and recreation prices remained unchanged; other goods and services and transportation and communication prices fell 2.7% and 1.3%, respectively; household goods and services and clothing prices fell 0.2% and 0.1%, respectively.
In June 2026, the Producer Price Index rose 4.1% YoY and fell 0.3% MoM
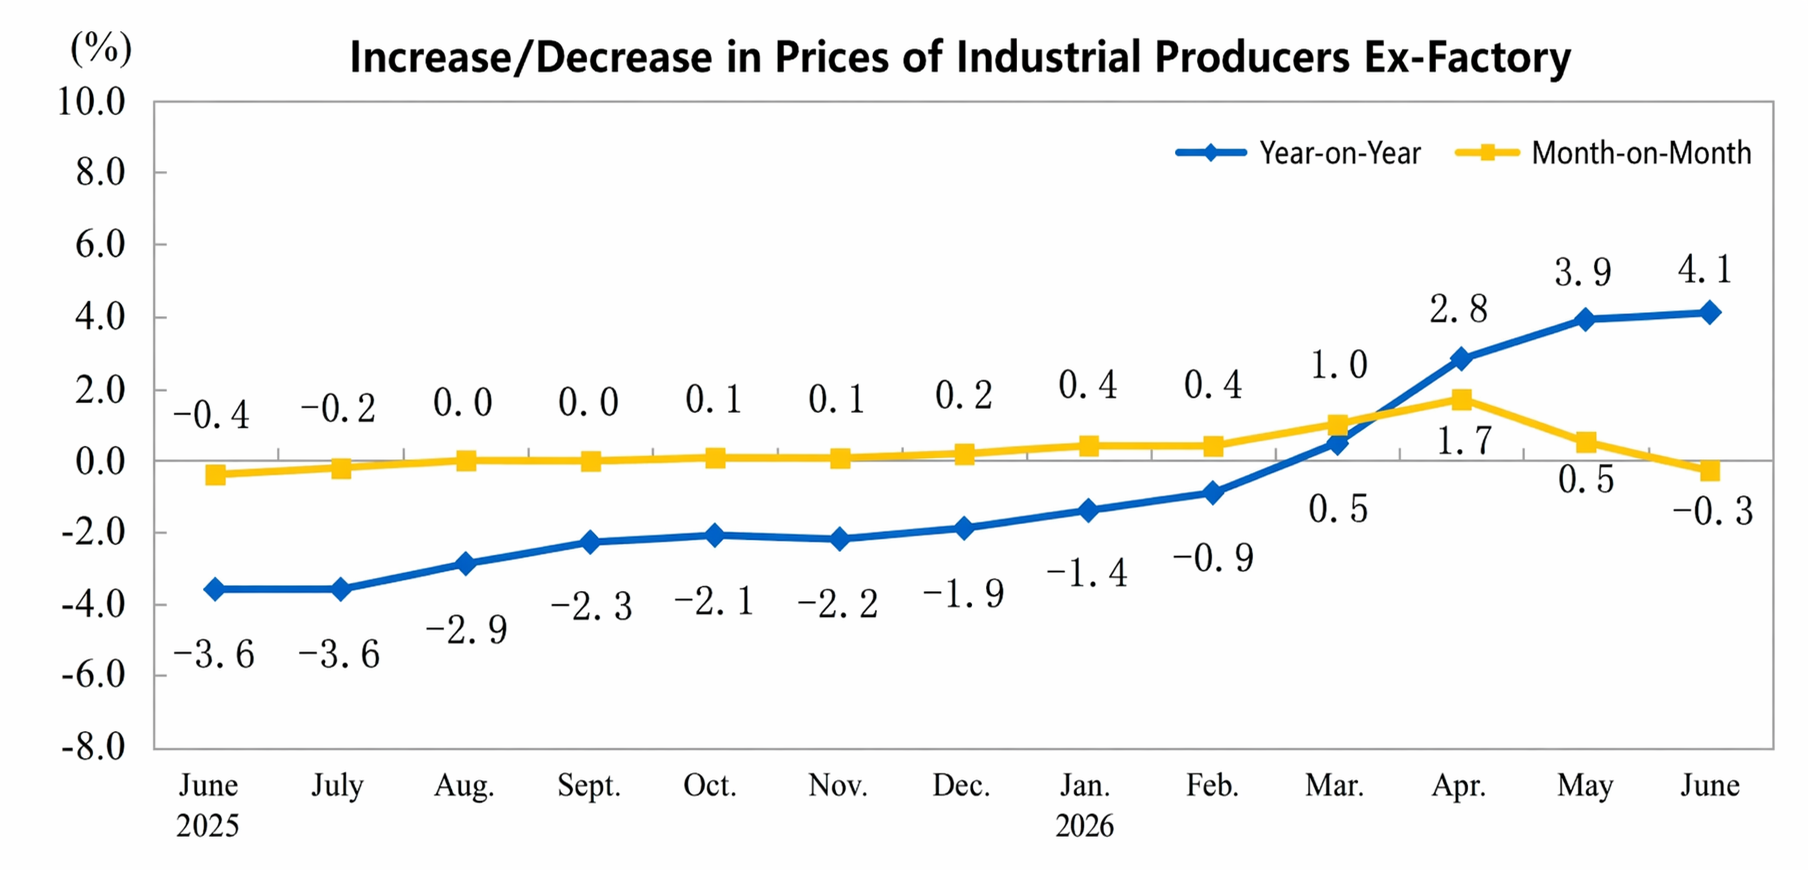
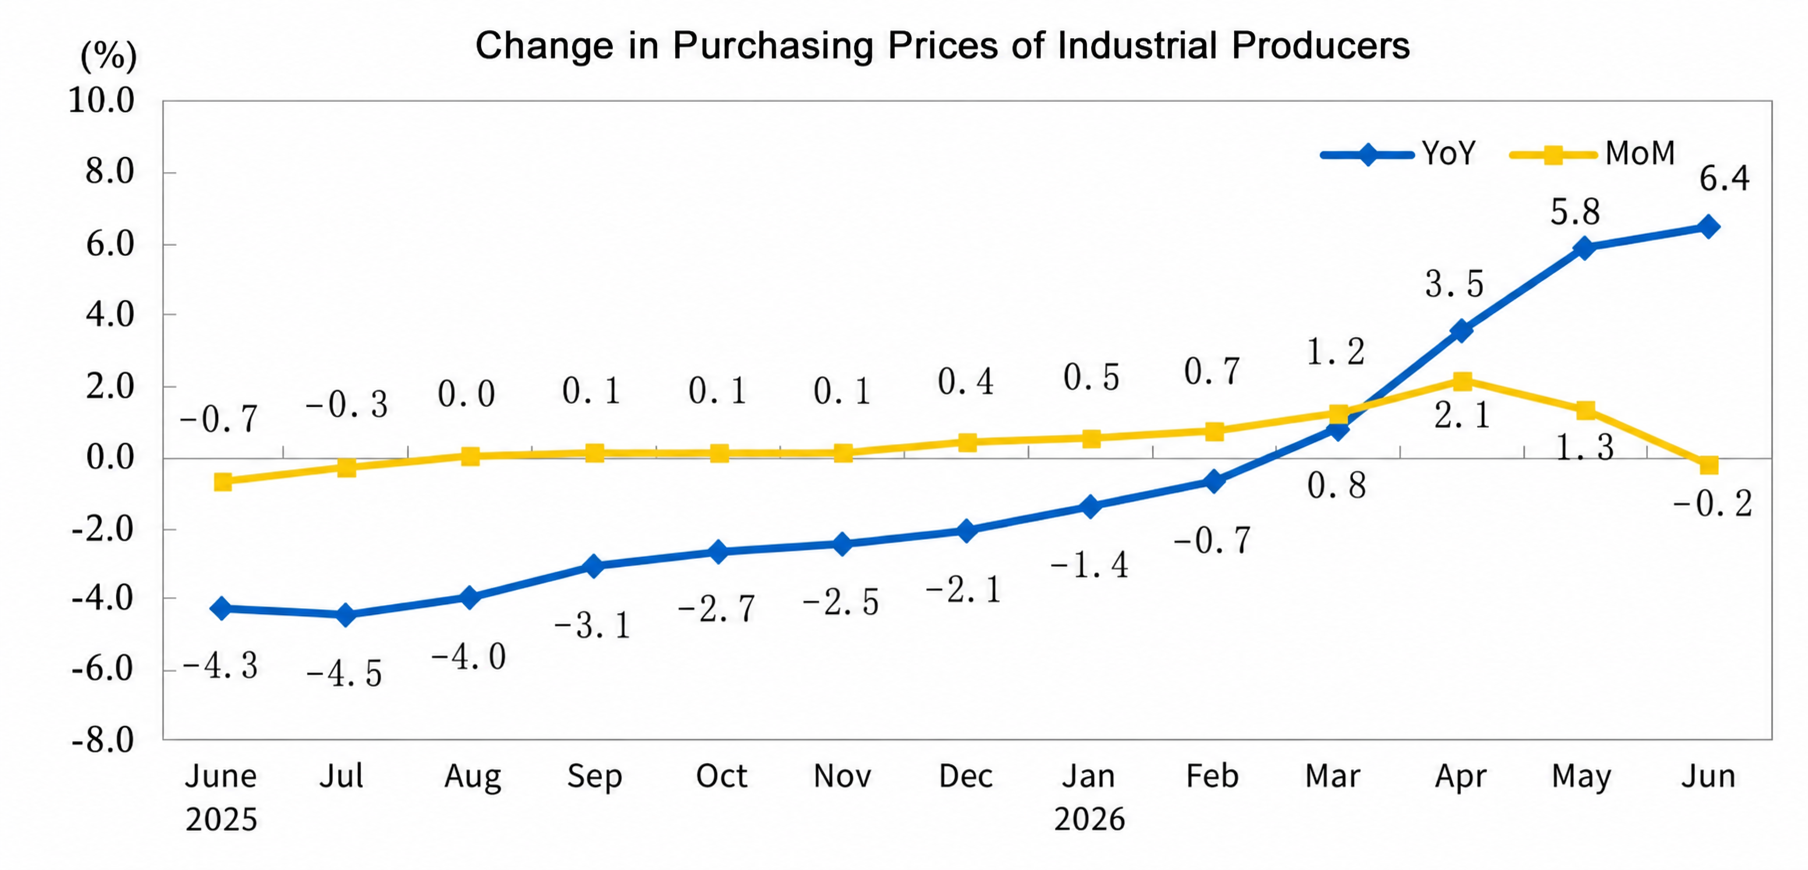
In June 2026, the national Producer Price Index rose 4.1% YoY and fell 0.3% MoM. The Purchasing Price Index for industrial producers rose 6.4% YoY and fell 0.2% MoM. In H1, the Producer Price Index rose 1.5% YoY, and the Purchasing Price Index rose 2.4% YoY.
I. YoY Changes in Industrial Producer Prices
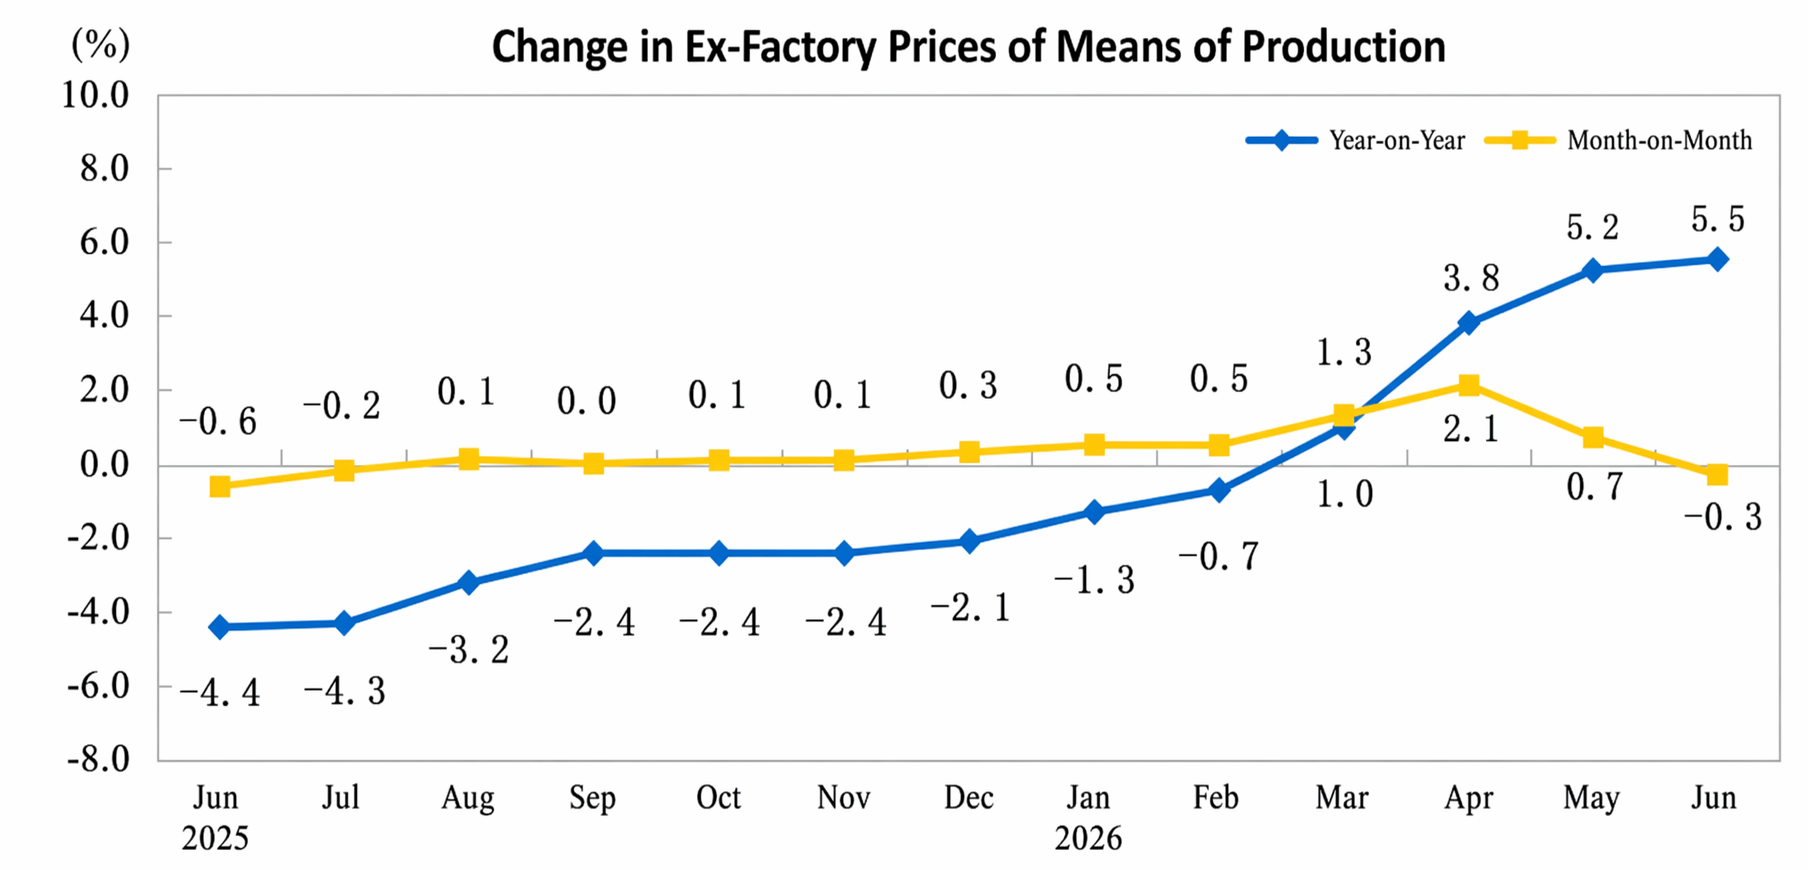
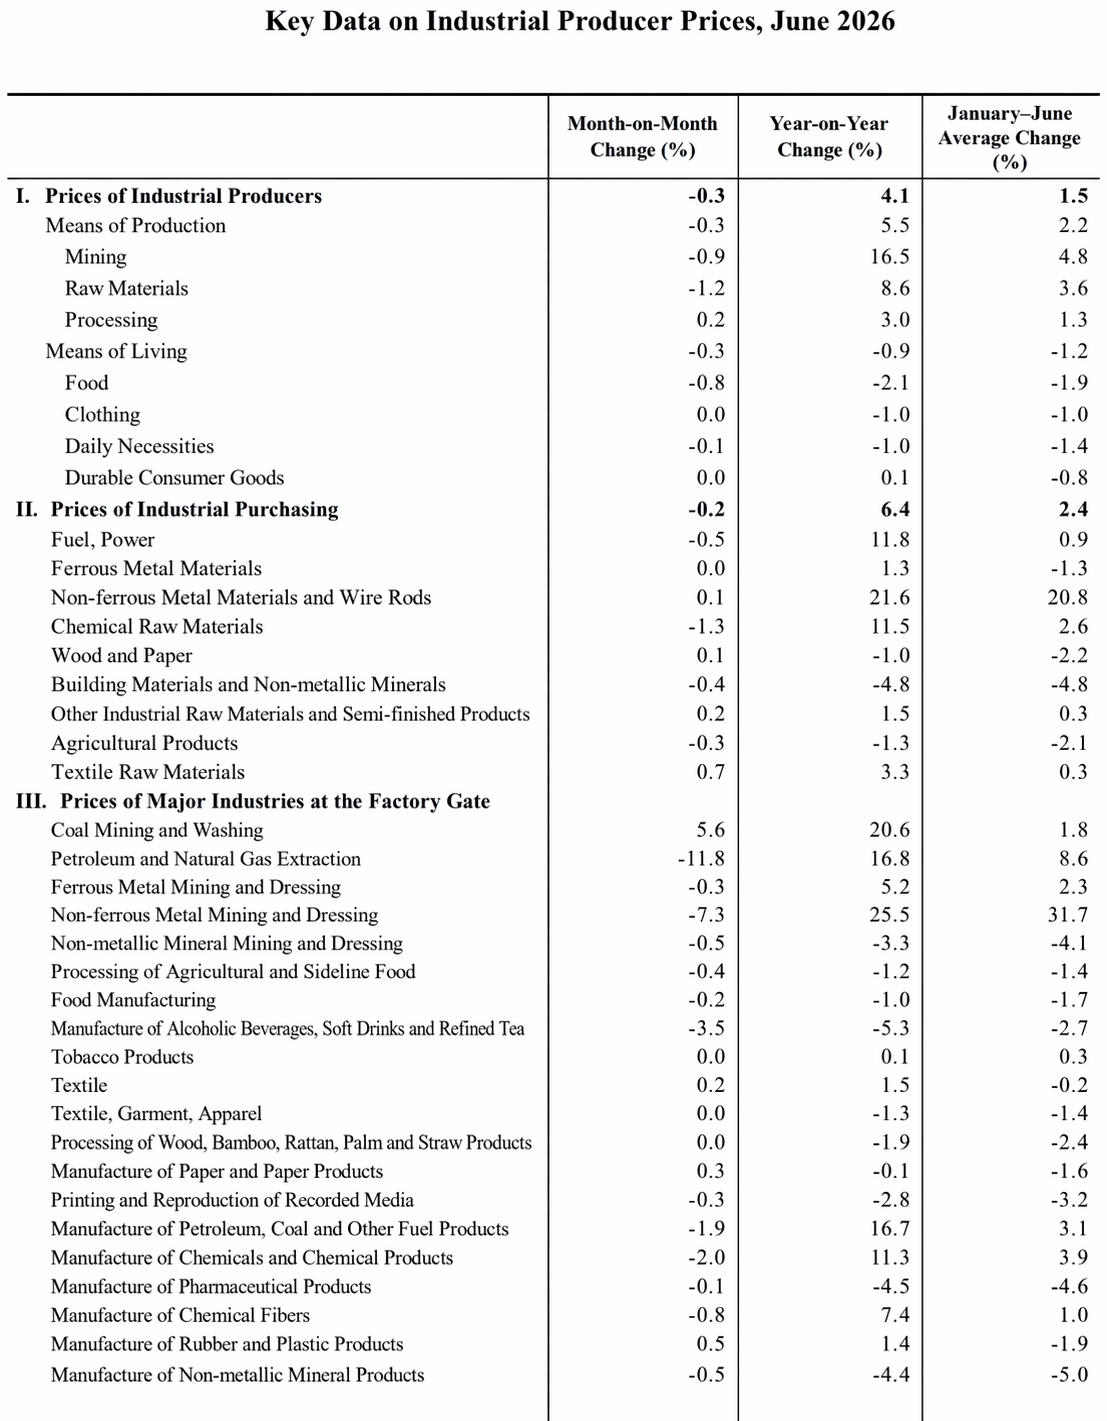
In June, within the Producer Price Index, prices for means of production rose 5.5% YoY, contributing approximately 4.28 percentage points to the overall increase. Of which, prices for the mining industry rose 16.5%, raw material industry rose 8.6%, and processing industry rose 3.0%. Prices for consumer goods fell 0.9%, contributing approximately 0.20 percentage point to the overall decrease. Of which, food prices fell 2.1%, clothing and general merchandise prices both fell 1.0%, and durable consumer goods prices rose 0.1%.
Within the Purchasing Price Index, prices for non-ferrous metal materials and wires rose 21.6%, fuels and power rose 11.8%, chemical raw materials rose 11.5%, textile raw materials rose 3.3%, and ferrous metal materials rose 1.3%; prices for building materials and non-metallic products fell 4.8%, and agricultural by-products fell 1.3%.
II. Month-on-Month Changes in Industrial Producer Prices
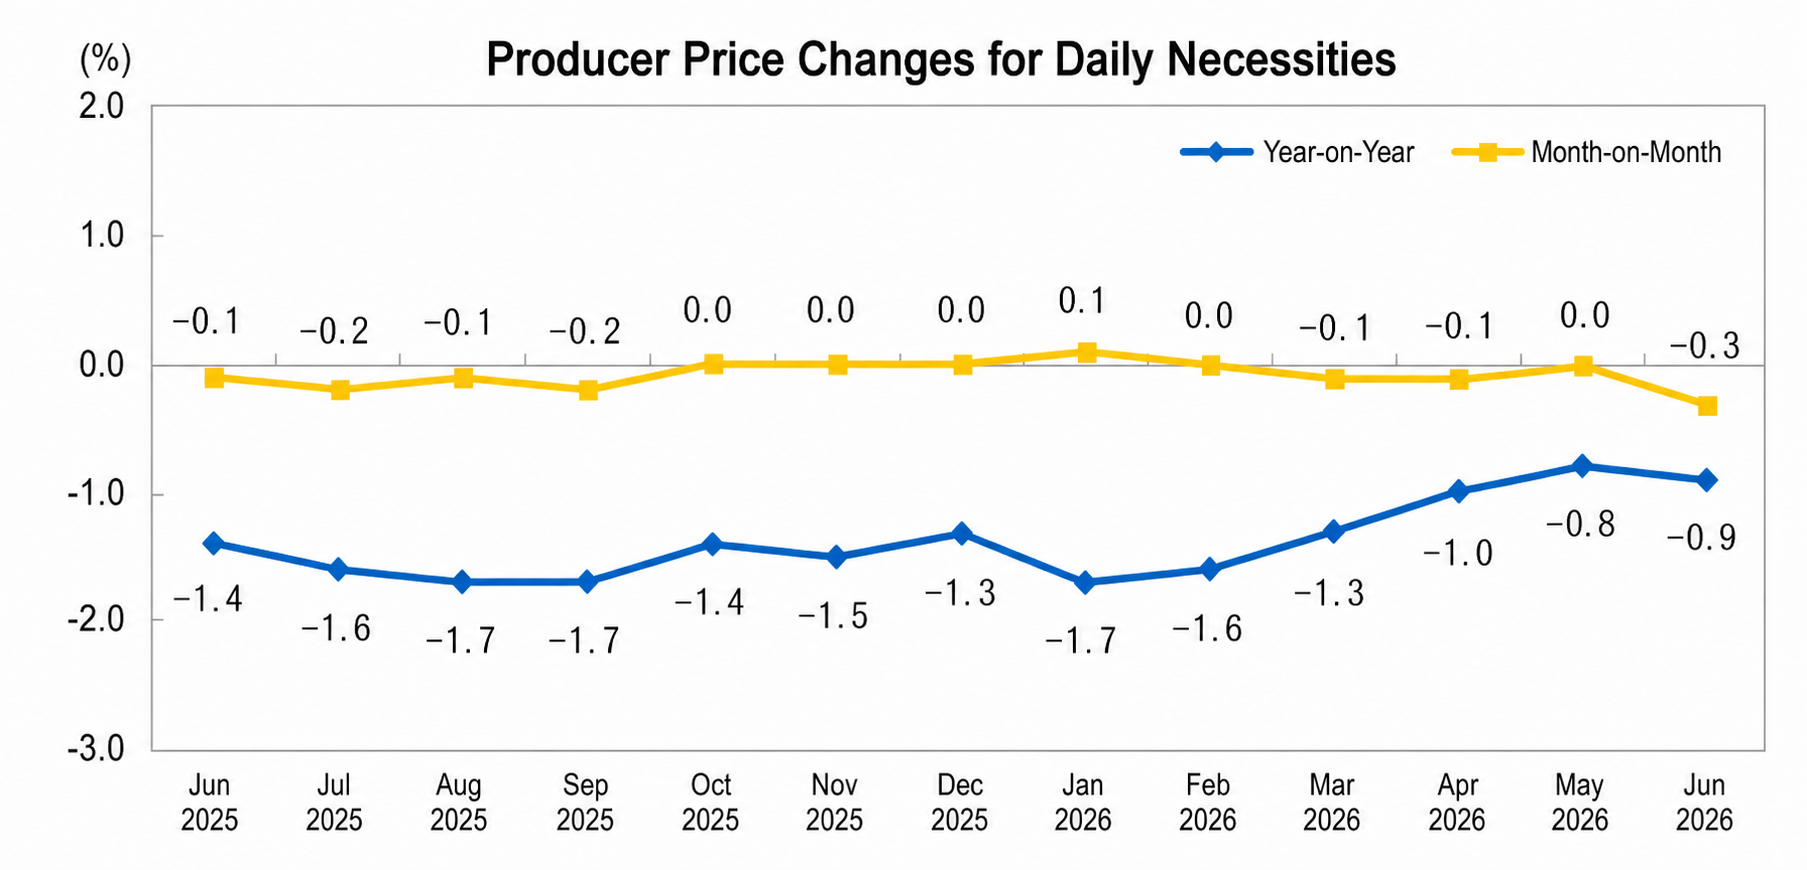
In June, among industrial producer prices, the means of production prices fell 0.3% MoM, dragging down the overall industrial producer price level by about 0.25 percentage points. Among them, mining and quarrying prices fell 0.9%, raw materials prices fell 1.2%, and processing industry prices rose 0.2%. Consumer goods prices fell 0.3%, dragging down the overall industrial producer price level by about 0.06 percentage points. Among them, food prices fell 0.8%, clothing and durable consumer goods prices remained flat, and general daily necessities prices fell 0.1%.
In industrial producer purchasing prices, chemical raw materials prices fell 1.3%, fuels and power prices fell 0.5%, building materials and non-metallic minerals prices fell 0.4%, and agricultural and sideline products prices fell 0.3%; textile raw materials prices rose 0.7%, and non-ferrous metal materials and wires prices rose 0.1%; ferrous metal materials prices remained flat.

In June 2026, CPI Maintained Mild YoY Growth While PPI YoY Increase Slightly Expanded
— Interpretation of June 2026 CPI and PPI Data by Dong Lijuan, Chief Statistician of the Urban Department of the National Bureau of Statistics
In June, affected by seasonal factors and fluctuations in international market prices, the Consumer Price Index (CPI) fell 0.3% MoM and rose 1.0% YoY. The core CPI, which excludes food and energy prices, rose 1.0% YoY, continuing to maintain a mild increase. While demand in some domestic sectors increased, affected by factors such as the decline in international crude oil prices, the Industrial Producer Price Index (PPI) fell 0.3% MoM and rose 4.1% YoY.
I. CPI Maintained Mild Growth
On a MoM basis, the nationwide CPI fell 0.3%. Affected by international market price fluctuations, domestic gold jewelry and gasoline prices fell 8.7% and 4.9%, respectively, with the declines widening by 5.9 and 4.6 percentage points from the previous month, together contributing to a roughly 0.22 percentage point drop in the CPI MoM, and the downward pull on the CPI increased by about 0.19 percentage points from the previous month. Food prices fell 0.4%, the same decline as the previous month, dragging down the CPI MoM by about 0.07 percentage points. Within food, seasonal fruits and vegetables were supplied in abundance, with fresh vegetable and fruit prices falling 1.0% and 2.0%, respectively, together contributing to a roughly 0.06 percentage point drop in the CPI MoM; pork and aquatic product prices fell 0.8% and 0.6%, respectively, together dragging down the CPI MoM by about 0.02 percentage points; laying hen inventories were at low levels, compounded by reduced egg production rates due to high temperatures, causing egg prices to rise 7.0%, which contributed about 0.03 percentage points to the CPI MoM increase. Service prices turned flat after a 0.1% decline the previous month. Within services, affected by factors such as airlines lowering fuel surcharges and off-season travel demand pulling back, prices for hotel accommodation, airfare, and travel agency fees dropped 5.3%, 4.0%, and 0.7%, respectively, dragging down the CPI by about 0.04 percentage points MoM in total; affected by policy-driven price adjustments in some regions, national medical service prices rose 0.3%, contributing about 0.02 percentage points to the CPI MoM.
On a YoY basis, the national CPI rose 1.0%, and the growth rate pulled back by 0.2 percentage points from the previous month. Driven by international imported factors, the price increase of domestic industrial consumer goods pulled back. Prices of industrial consumer goods rose 2.9%, with the growth rate pulling back by 1.0 percentage points from the previous month. They contributed about 0.90 percentage points to the YoY CPI increase, and their upward push effect on the CPI decreased by about 0.28 percentage points from the previous month. Among industrial consumer goods, the price increases for gold jewelry and gasoline pulled back to 28.1% and 17.0%, respectively. Together, they contributed about 0.60 percentage points to the YoY CPI increase, and their upward push effect on the CPI decreased by about 0.23 percentage points from the previous month; prices of personal care products and household appliances rose 2.3% and 2.2%, respectively, with both growth rates pulling back. Service prices rose 0.8%, the same growth rate as the previous month, contributing about 0.40 percentage points to the YoY CPI increase. Within services, prices of medical services and education services rose 3.4% and 0.6%, respectively. Prices of housekeeping services and dining out rose 1.4% and 1.1%, respectively, with overall stable growth rates. Food prices fell 1.6%, with the decline narrowing by 0.1 percentage points from the previous month, dragging down the YoY CPI by about 0.28 percentage points. Within food, pork prices dropped 15.9%, with the decline narrowing by 0.2 percentage points from the previous month, dragging down the YoY CPI by about 0.30 percentage points; prices of fresh vegetables, fresh fruits, grain, edible oil, dairy products, and aquatic products fell within a range of 0.3% to 1.7%; egg prices rose 20.0%, with the growth rate expanding by 11.6 percentage points from the previous month; prices of mutton, beef, and poultry meat rose within a range of 1.4% to 6.0%.
2. PPI YoY Growth Slightly Widened
On a MoM basis, the national PPI fell 0.3%. The main characteristics of the PPI MoM movement this month: First, the decline in international crude oil prices led to price drops in related domestic industries. Petroleum extraction prices fell 16.0% MoM, and refined petroleum product manufacturing prices fell 3.1%, with the declines widening by 14.2 and 2.8 percentage points, respectively, from the previous month. Prices in the manufacturing of chemical raw materials and chemical products, as well as chemical fiber manufacturing, turned from increases in the previous month to declines of 2.0% and 0.8%, respectively. Second, influenced by seasonal factors, price trends diverged across certain industries. In June, rising temperatures drove higher demand for coal stockpiling ahead of the summer peak and for cooling products. Prices for coal mining and washing rose 5.6% MoM, household refrigeration appliances increased 0.6%, and refrigeration and air-conditioning equipment grew 0.4%. Abundant summer precipitation, sunlight, and wind led to price declines in hydropower, solar power, and wind power, which fell 9.1%, 2.5%, and 2.2%, respectively. Third, accelerated industrial upgrading boosted demand and pushed prices higher in select sectors. With continuously expanding AI application scenarios, broad adoption of new raw materials and advanced materials, and sustained progress in green transformation, prices for virtual reality equipment manufacturing rose 8.4% MoM, wearable smart device manufacturing increased 3.4%, industrial control computers and systems rose 3.3%, and industrial robot manufacturing grew 0.5%. Prices for electronic specialty materials rose 2.5%, carbon-based nanomaterials increased 1.9%, biomass fuel processing grew 1.2%, and the comprehensive utilization of waste resources industry rose 0.4%.
On a YoY basis, the national PPI rose 4.1%, with the growth rate expanding by 0.2 percentage points compared to the previous month. Among industries recording price increases, coal mining and washing rose 20.6%, electrical machinery and equipment manufacturing grew 5.1%, computer, communications, and other electronic equipment manufacturing increased 3.3%, and ferrous metal smelting and rolling processing rose 3.1%, all seeing wider growth rates than the previous month. Together, these four industries contributed approximately 1.39 percentage points to the YoY PPI increase. Non-ferrous metal ore mining and dressing, along with non-ferrous metal smelting and rolling processing, rose 25.5% and 23.4%, respectively. Oil and natural gas extraction, petroleum, coal, and other fuel processing, and chemical raw material and chemical product manufacturing rose 16.8%, 16.7%, and 11.3%, respectively, with all three seeing a pullback in growth rates compared to the previous month. These five industries collectively contributed about 3.25 percentage points to the YoY PPI increase. Among industries recording price declines, non-metallic mineral products fell 4.4%, with the decline narrowing by 0.7 percentage points from the previous month. Electricity, heat production, and supply dropped 4.4%, unchanged from the prior month. Alcoholic beverages and refined tea manufacturing, along with automobile manufacturing, fell 5.3% and 2.1%, respectively, with the declines widening by 3.4 and 0.1 percentage points from the previous month. Together, these four industries dragged down the YoY PPI by approximately 0.72 percentage points.
![US-Iran Uncertainties Resurface, LME Zinc Falls [SMM Morning Meeting Summary]](https://imgqn.smm.cn/usercenter/TeRBO20251217171754.jpg)
![The most-traded SHFE tin contract opened lower in the night session and then moved sideways, while downstream buyers in the spot market mainly made just-in-time procurement [SMM tin morning news]](https://imgqn.smm.cn/usercenter/WWXJU20251217171753.jpg)
![Crude Oil Surges, Base Metals Broadly Decline, LME Tin, SHFE Tin, LME Zinc, Stainless Steel Lead Losses, NY Silver Drops Over 4% [Overnight Market]](https://imgqn.smm.cn/usercenter/gpWpd20251217171734.jpeg)