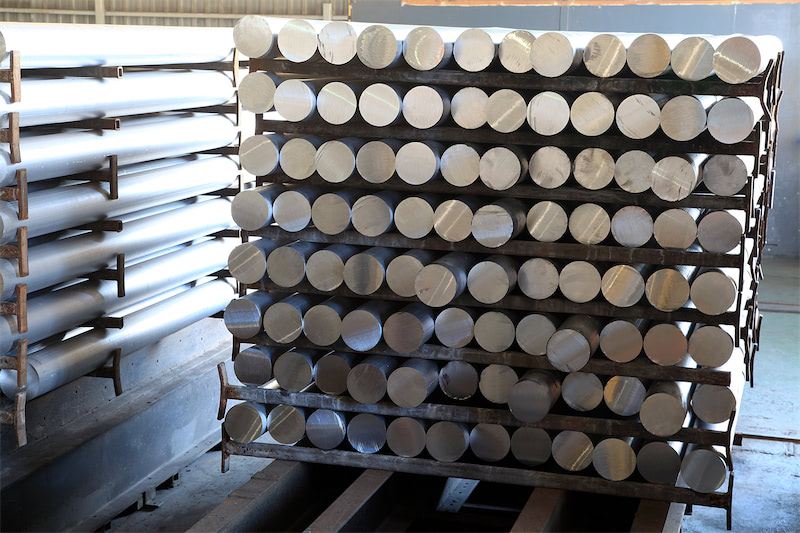
SMM July 8 News:
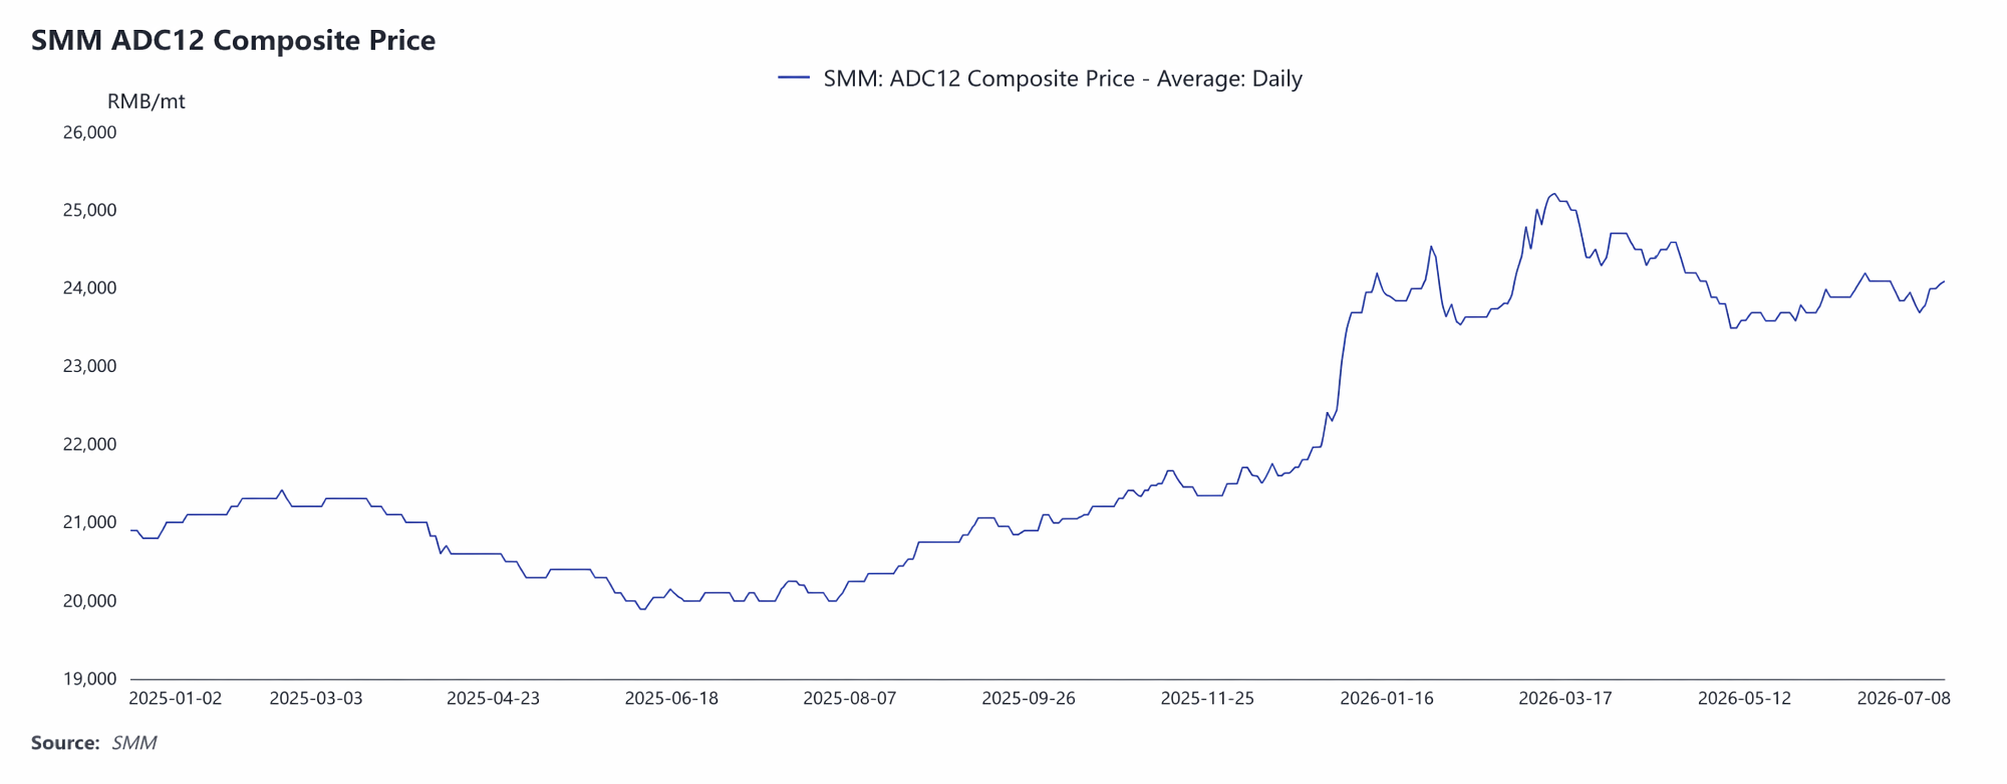
I. Price Trend Review: ADC12 average price in H1 was 24,082 yuan/mt, with the central level clearly shifting upward.
In H1 2026, SMM ADC12 prices showed a pattern of fluctuating upward before consolidating at highs. The H1 average price was 24,082 yuan/mt, up 3,296 yuan/mt from the 2025 average, an increase of 15.8%.
Looking at the stages separately:
Stage 1: January–mid-March: Costs and macro factors resonated, accelerating the price rise.
At the start of the year, driven by A00 aluminum prices strongly breaking through 24,000 yuan/mt, ADC12 quickly followed and rose from 23,100 yuan/mt at the beginning of the year to 24,550 yuan/mt by end-January. Around the Chinese New Year in February, transactions cooled, and prices pulled back to the 23,550-23,650 yuan/mt range for consolidation. After the Lantern Festival, production resumptions began, coupled with high aluminum scrap costs and Middle East geopolitical conflicts pushing up overseas aluminum prices, In mid-March, ADC12 surged to the H1 high of 25,200 yuan/mt.
Stage 2: late March–May: Demand weakened, and prices continued to pull back.
From late March, end-use demand recovery fell short of expectations, and prices continued to fall from highs, dropping to 23,800 yuan/mt by end-April. In May, as the traditional consumption off-season set in, downstream procurement became more cautious, and coupled with the continuous accumulation of social inventory, prices hit the H1 second-lowest point of 23,500 yuan/mt on May 7.
Stage 3: June–early July: Costs provided a floor, and a narrow recovery occurred.
In June, amid insufficient tax invoices, support from aluminum scrap costs, and some enterprises cutting production to hold prices firm, prices stabilized and rebounded slightly to around 24,200 yuan/mt. As of July 8, SMM ADC12 was at 24,100 yuan/mt.
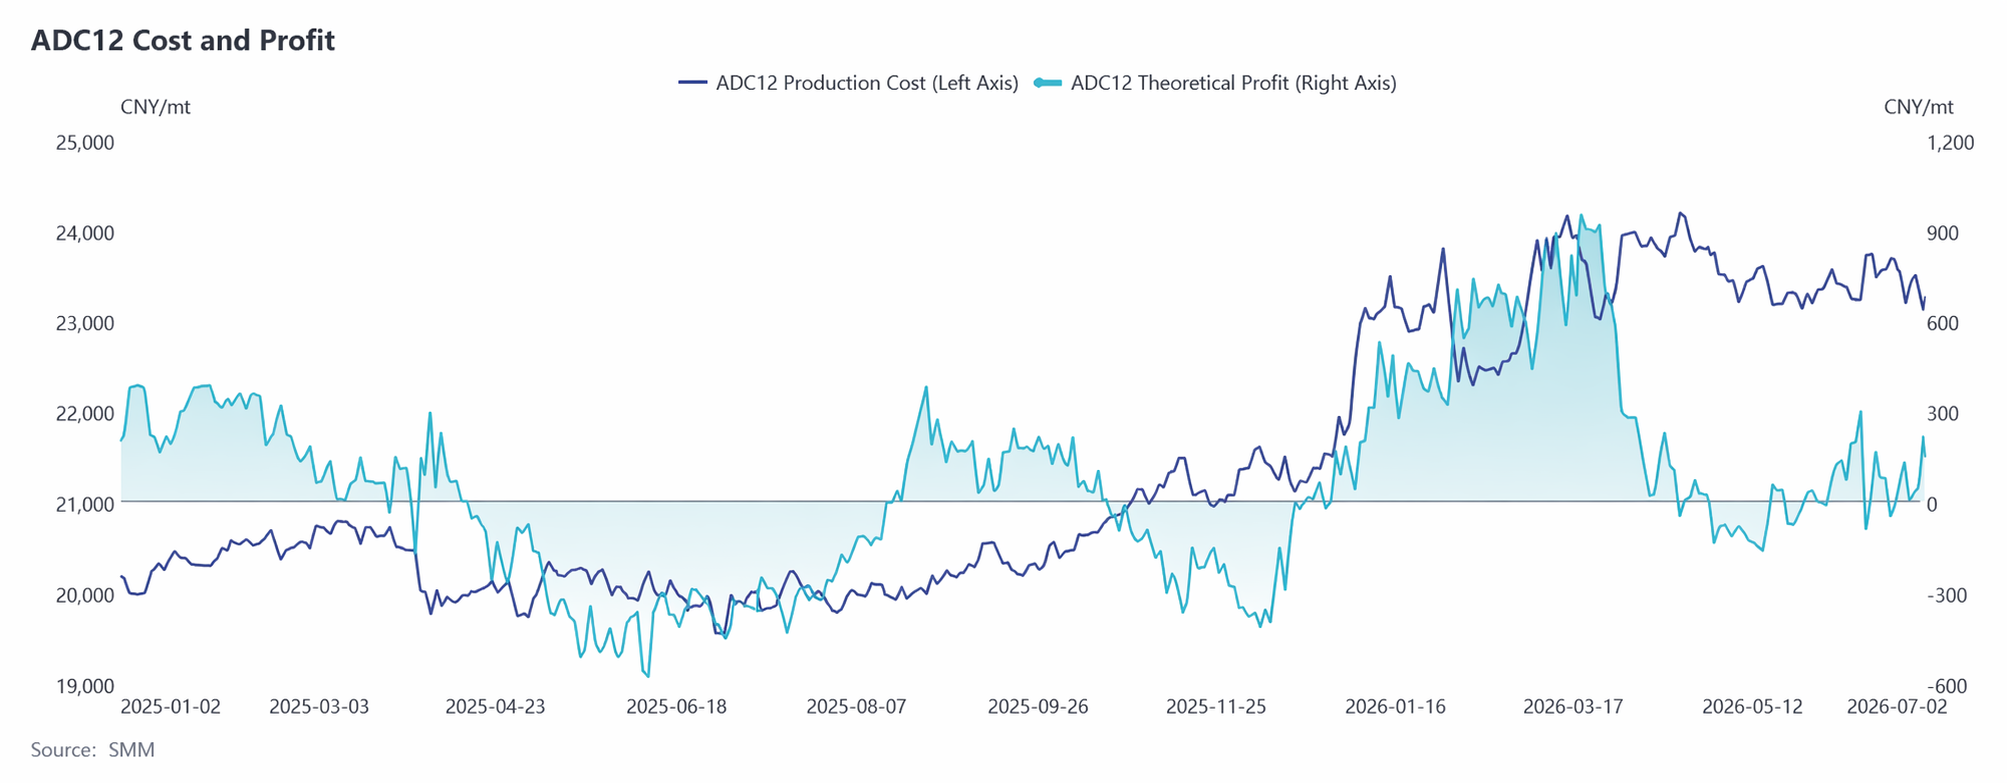
II. Cost Side Analysis: Aluminum scrap cost proportion exceeds 90%, industry profits gradually narrow.
Since 2026, the ADC12 industry's costs and profits have shown the characteristic of “costs running at highs and profits continuously narrowing.” At the start of the year, driven by rising primary aluminum prices and climbing aluminum scrap procurement costs, the industry's theoretical production costs rapidly rose to around 24,000 yuan/mt. During the same period, ADC12 prices increased quickly, with the theoretical profit per mt briefly reaching 800-900 yuan. Subsequently, although costs pulled back slightly with the aluminum price correction, they remained above 23,000 yuan/mt. Meanwhile, profits were rapidly compressed due to continuously weakening end-use demand, falling ADC12 prices, and stubbornly high aluminum scrap and tax costs. In Q2, profits approached the break-even line, and some enterprises even experienced periodic losses. Since Q2, tax invoice regulation such as the “invoicing economy” has been tightening, with tight supply of compliant aluminum scrap and limited import supplements. Aluminum scrap prices showed strong resistance to declines, making it difficult for the cost center to shift significantly lower, further squeezing profit margins. Entering June, production cuts, supply contraction, and greater price resilience in ADC12 led to some profit recovery, though margins remained low at just 200–300 yuan/mt. January-June theoretical total costs rose 14.1 percentage points YoY to 23,326 yuan/mt, with a theoretical single-ton profit of approximately 285 yuan. While some enterprises began increasing the blending ratio of A00 primary aluminum after June, this was more a passive response to invoice shortages and aluminum scrap procurement difficulties rather than enough to alter the cost structure still dominated by scrap.
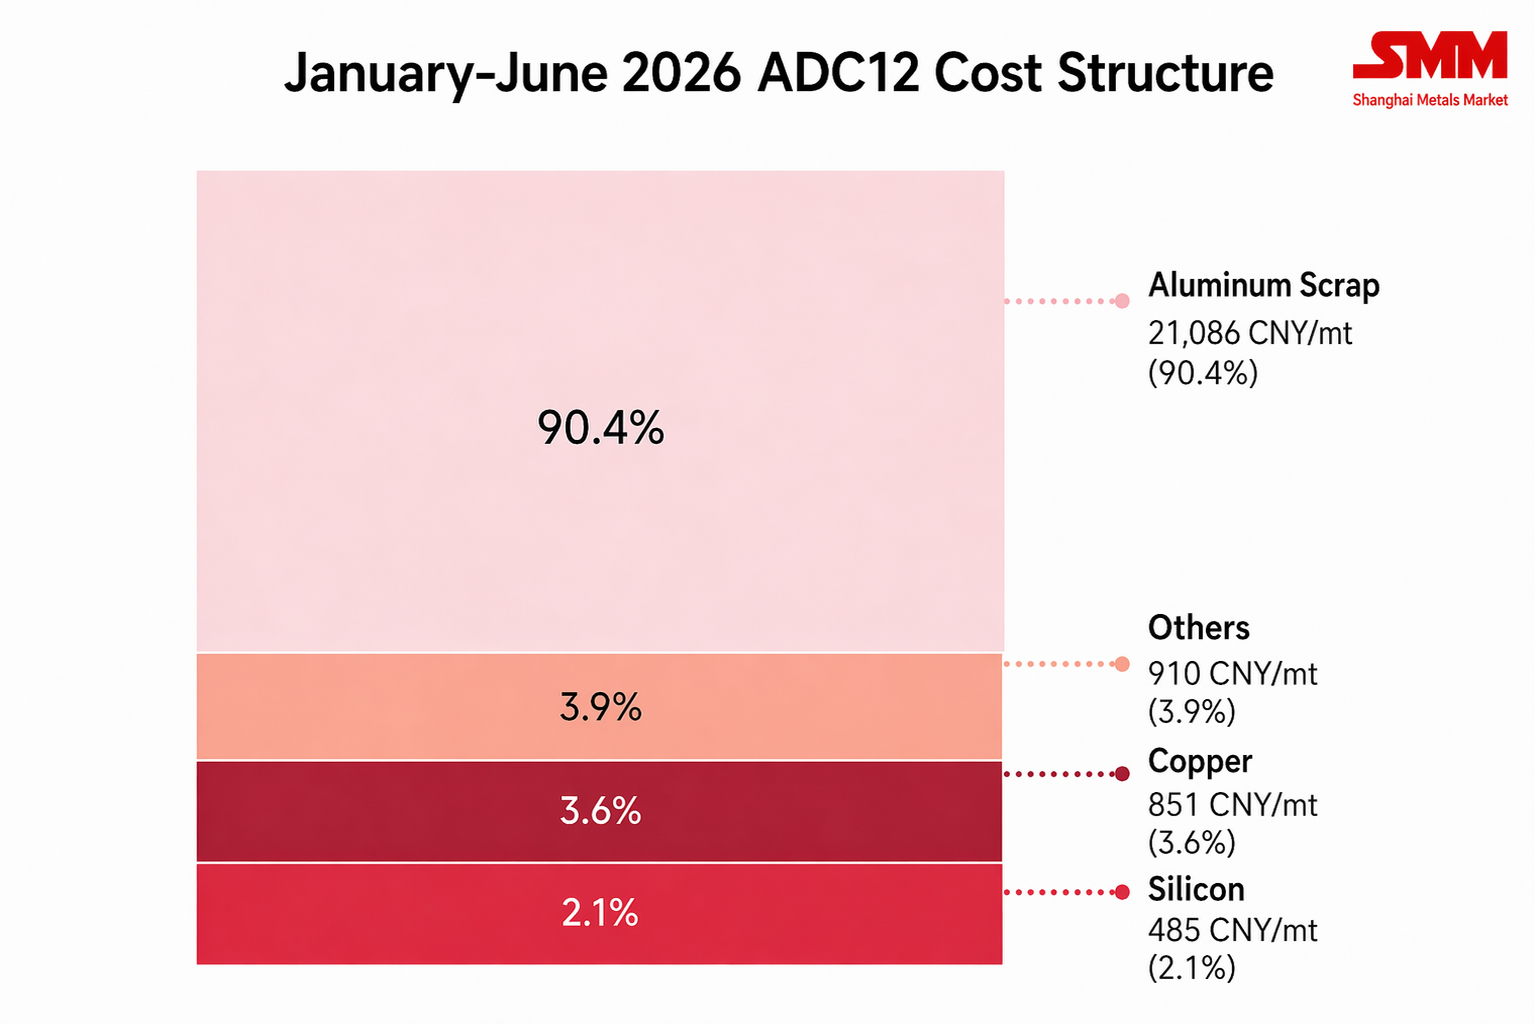
Looking at the cost structure in H1, aluminum scrap costs stood at about 21,086 yuan/mt, accounting for 90.4%; copper costs at 851 yuan/mt, accounting for 3.6%; and silicon costs at 485 yuan/mt, accounting for 2.1%. Among these, the cost share of aluminum scrap and copper continued to rise, while silicon's share maintained its pullback.
III. Supply-Side Review: Tightening Policies Aggravate Aluminum Scrap Shortage, Production Side Continues to Cut Loads
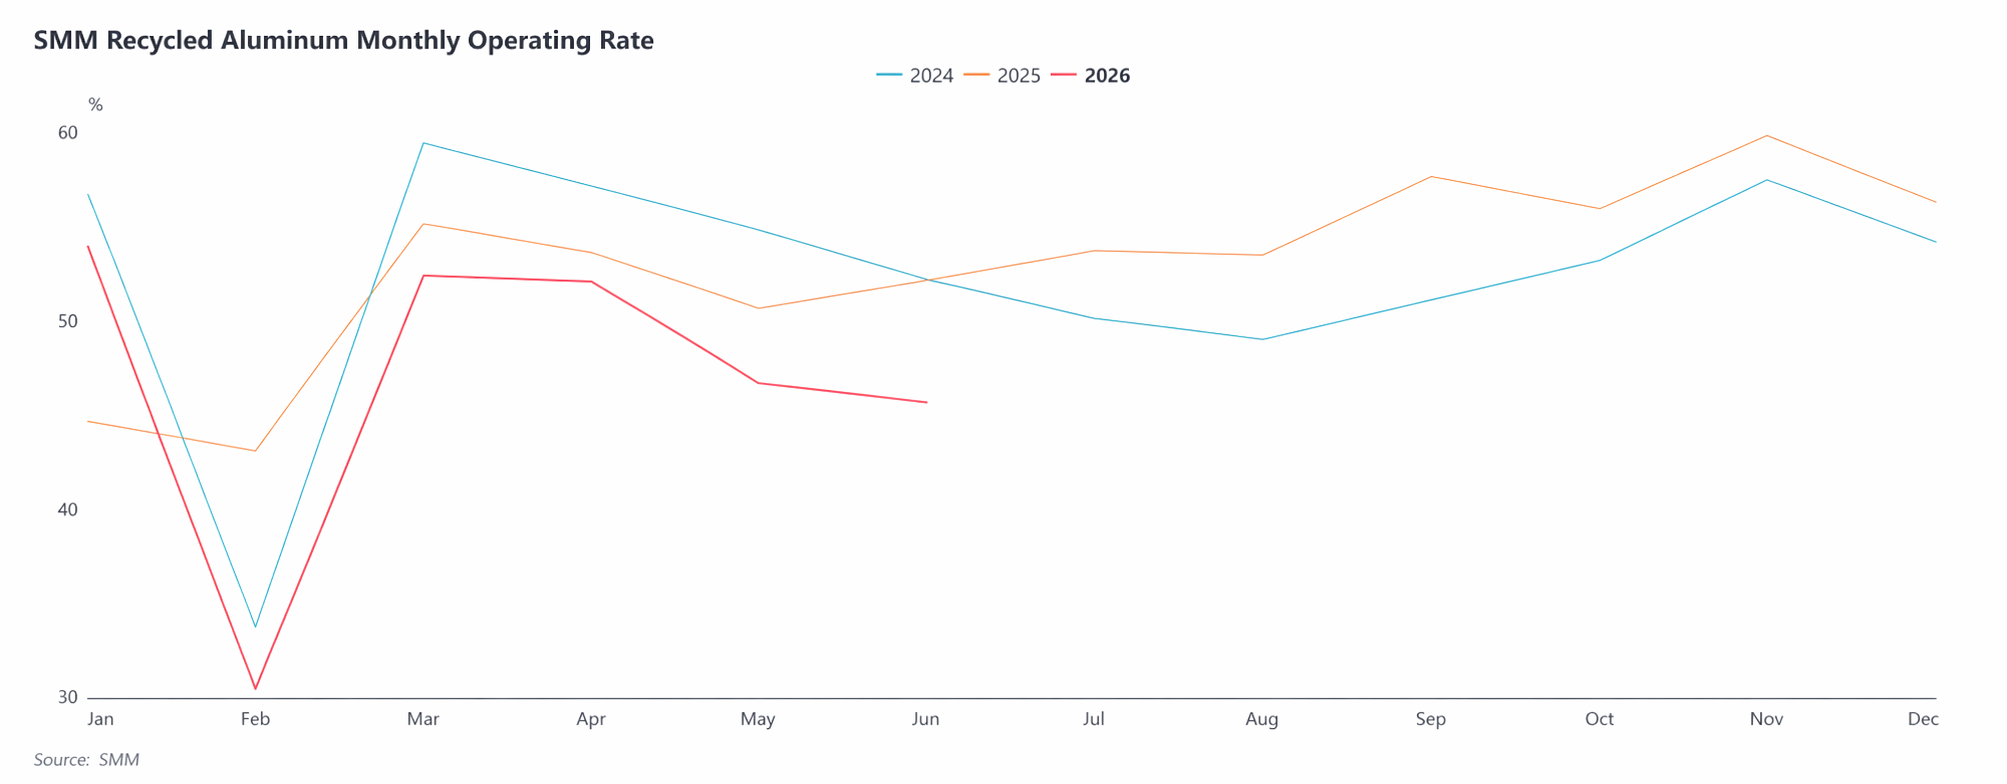
In H1, the secondary aluminum industry's operating rate exhibited seasonal fluctuations but weakened overall on a YoY basis. Operating rates began the year on a solid footing. A later Chinese New Year allowed normal production, with the rate reaching 53.9%, a marked YoY improvement. It plunged to 30.5% in February due to the holiday before quickly recovering to 52.3% in March, albeit slightly below the same period last year. Entering Q2, a confluence of factors—persistently sluggish end-use demand, stricter tax invoice oversight, difficulties in procuring compliant aluminum scrap, and continuously narrowing corporate profits—pushed the industry's operating rate down from April onward. It fell to 45.6% in June, hitting a new year-low excluding the Chinese New Year month, with the YoY decline widening from 0.5 percentage points in April to 6.5 percentage points in June, further intensifying the supply contraction. According to SMM statistics, China's secondary aluminum alloy production totaled 3.17 million mt, January-June 2026, down 8.6% YoY and significantly below early-year expectations.
IV. Demand-Side Review: End-User Production and Sales Under Pressure, Off-Season Effects Pronounced
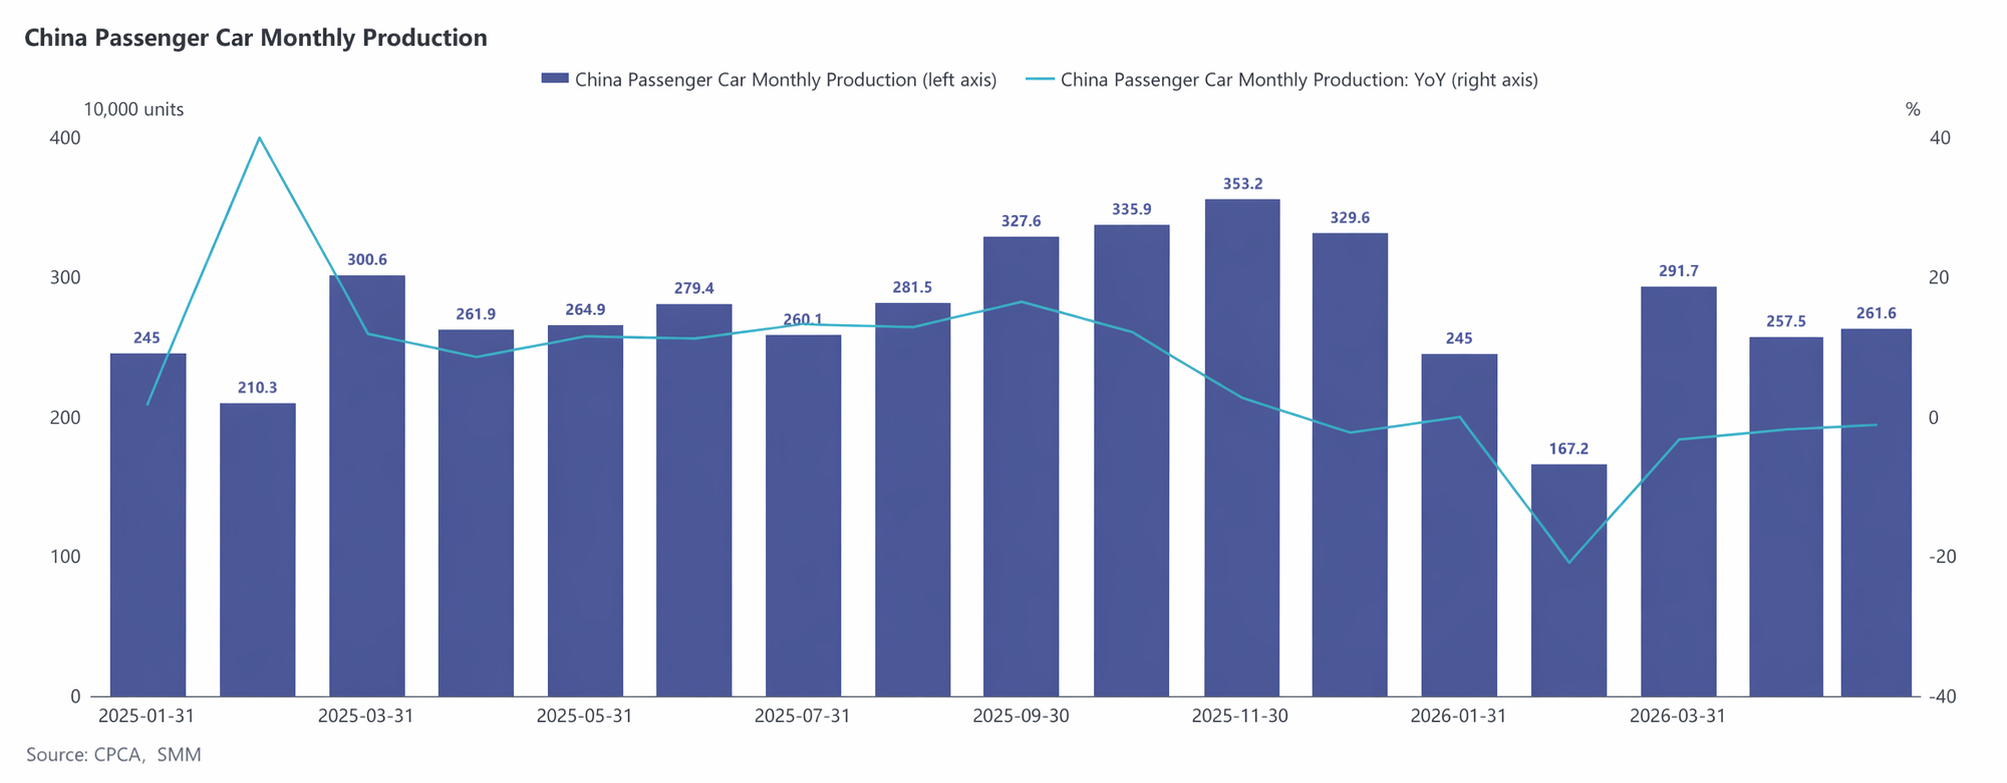
Demand side, the secondary aluminum market was generally weak overall in H1. In Q1, the Chinese New Year holiday delayed the resumption of end-user operations, with order recovery falling short of expectations. Simultaneously, high prices further suppressed downstream purchase willingness. These overlapping factors rendered the traditional "Golden March" peak season lackluster—downstream enterprises mainly made just-in-time procurement, and downstream price transmission was sluggish. In Q2, weakening automotive sector prosperity and sluggish end-use consumption led to persistently contracting orders at secondary aluminum plants. CAAM data shows that China's automobile production and sales in January-May 2026 reached 12.235 million units and 12.207 million units, respectively, representing YoY declines of 4.6% and 4.2%, with NEV production and sales up 2.5% and 3.5% respectively, pushing the NEV penetration rate up to 47.5%, but this was not enough to effectively offset the impact of declining demand for traditional ICE vehicles. Affected by policy adjustments, market structural changes, and macro-economic pressure, China's automotive market weakened YoY, with "domestic demand under pressure" becoming the main theme of the auto industry in H1. In contrast, auto exports maintained strong resilience, with cumulative exports reaching 4.24 million units in January-May, up 49% YoY, which supported some secondary aluminum orders to an extent, but the overall boost was limited.
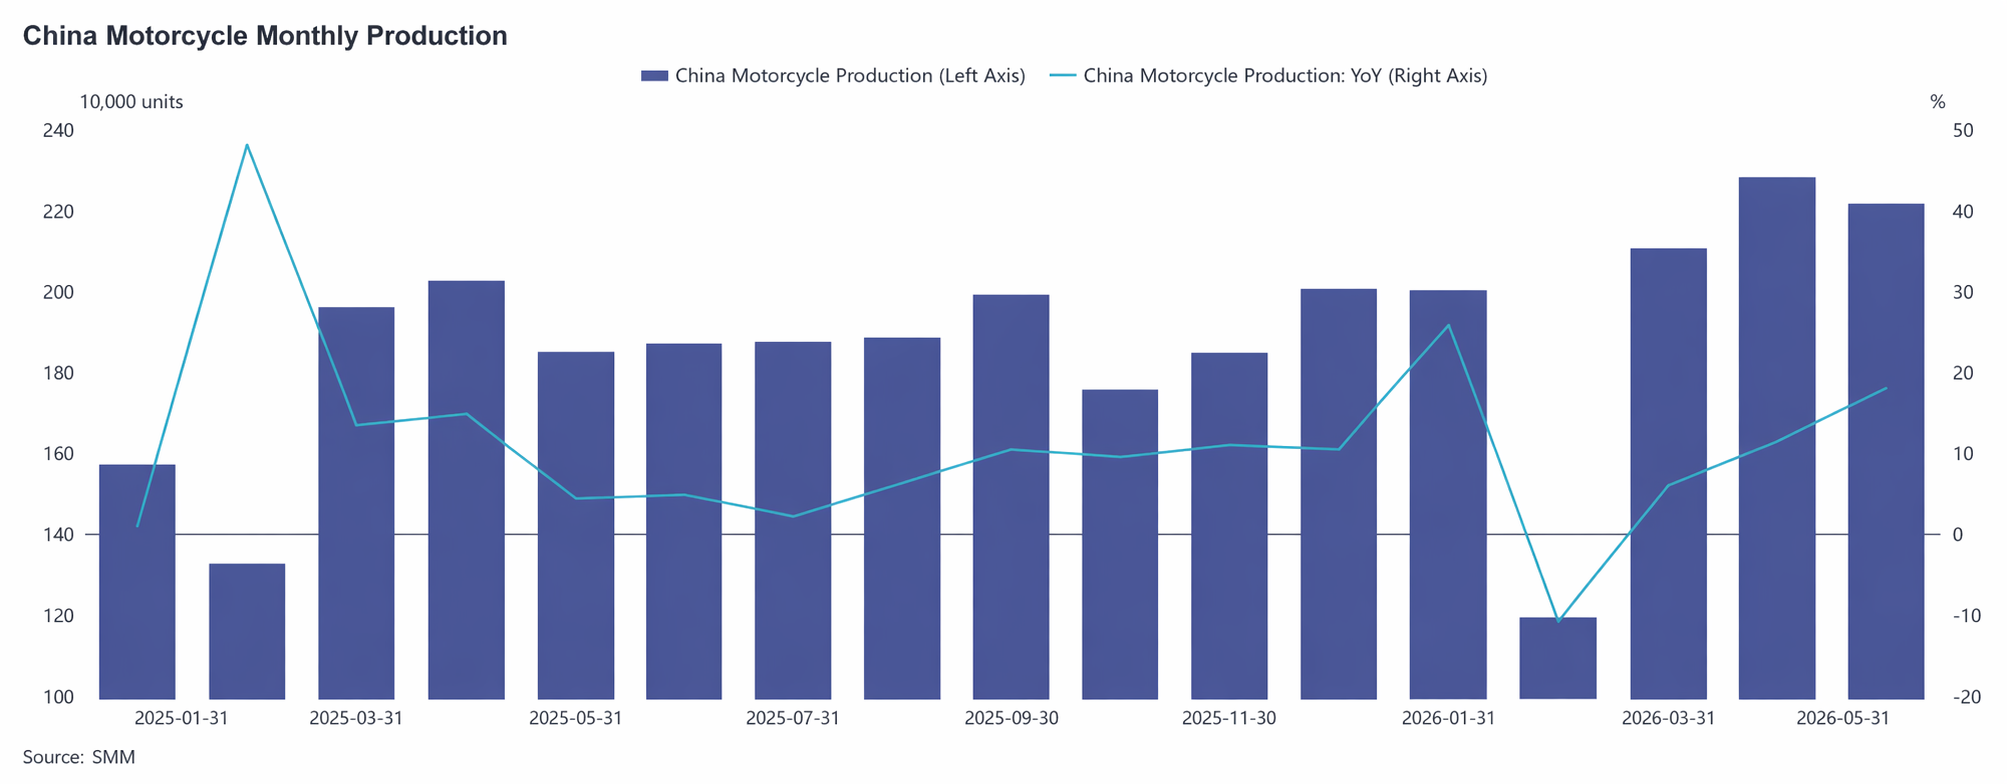
Demand in the motorcycle industry showed steady improvement. According to data from the China Chamber of Commerce for Motorcycles, motorcycle production and sales reached 9.8208 million units and 9.8181 million units respectively in January-May, up 11.18% and 11.04% YoY. Benefiting from continued export growth and gradually improving domestic sales, the industry operated generally steadily and positively, providing some support for secondary aluminum demand. However, since automobiles still account for the main share of secondary aluminum alloy consumption, growth in other sectors was insufficient to compensate for the gap caused by weakening auto demand. Emerging sectors such as humanoid robots and energy storage showed positive driving effects on secondary aluminum demand, but their current application scale is limited, so their contribution remains relatively weak.
Overall, end-use consumption weakened YoY in H1, downstream enterprises' profits remained under sustained pressure, their acceptance of high-priced raw materials was limited, purchases were predominantly small-volume and based on rigid demand, and the willingness to rush to buy amid continuous price rise or restock at lows was insufficient. Secondary aluminum demand was generally weaker than expectations, providing limited upward drive for prices.
V. Import and Export Situation: Imports Declined Noticeably YoY, Exports Witnessed Explosive Growth
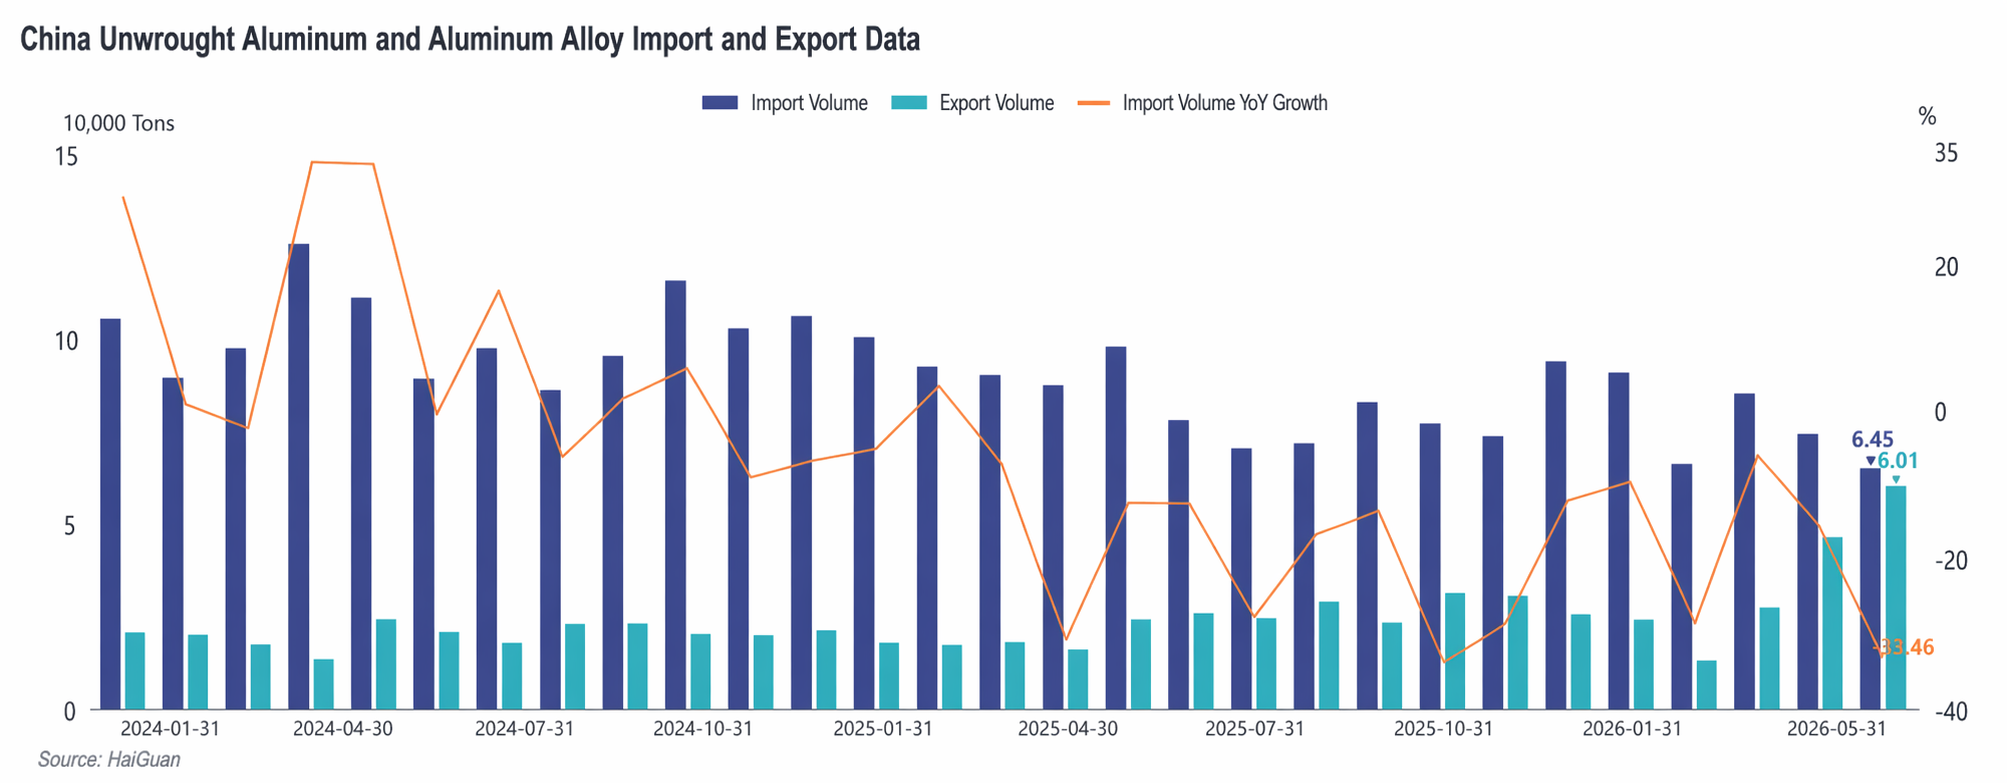
On the import side, from January to May 2026, China's cumulative imports of unwrought aluminum alloy were 379,000 mt, down 18.6% YoY, with import volumes continuing to shrink. The decline in imports during H1 was mainly affected by the long-term inversion of the price spread between Chinese and overseas markets. Since March, geopolitical conflicts in the Middle East have pushed up LME aluminum prices, with overseas ADC12 quotes once rising to a high above $3,400/mt, and the loss per ton on imports exceeding 3,500 yuan at its peak, leaving the import window persistently closed. After mid-May, as overseas prices pulled back following the LME and China's price center steadily moved upward, import losses narrowed to around 1,000 yuan. However, given that the absolute loss level remained high and import profitability had not yet recovered, overseas supply sources continued to play a limited supplementary role in the Chinese market. Imports in Q3 are expected to remain at low levels, with a potential rise in Q4.
On the export side, from January to May 2026, China's cumulative exports of unwrought aluminum alloy were 171,000 mt, surging 81.3% YoY. Export performance was strong in H1, driven mainly by the dual impetus of widening overseas supply gaps caused by Middle East geopolitical conflicts and improved cost-effectiveness of Chinese product exports. Markets in Japan, South Korea, Thailand, and other Asian countries exhibited robust demand, with notable growth achieved in both processing trade with imported materials and Ordinary Trade exports. April's export volume hit a new monthly high since July 2022. After entering Q2, as overseas supply gradually recovered and the price spread between Chinese and overseas markets narrowed, export profit margins began to be squeezed, and the momentum of export growth slowed marginally. Exports are expected to remain at relatively high levels in H2, but in absolute terms may pull back slightly from H1. Going forward, attention still needs to be paid to the progress of overseas supply chain recovery and changes in die-casting demand in Southeast Asia.
VI. H2 Outlook: Cost Support and Demand Recovery Dominate; Market to Consolidate at Highs
Looking ahead to H2 2026, the secondary aluminum alloy market is expected to continue to revolve around the two main themes of "cost support" and "demand recovery," maintaining an overall pattern of high costs and tight balance. Affected by factors such as the high base of H1 prices and weakening macro sentiment, the price center of ADC12 is expected to pull back from H1 but remain at a relatively high level historically.
Cost side, tax compliance regulation is unlikely to ease significantly in the short term, so compliant aluminum scrap supply will remain tight. The import window has not fully opened, and aluminum scrap prices are expected to continue to show strong resilience against declines, keeping the industry’s cost center high and providing a solid floor for ADC12 prices.
Supply side, the industry’s operating rate has some room to recover from the H1 low, but due to constraints from aluminum scrap supply and policy factors, production release will remain limited, with modest overall supply increments. Meanwhile, overseas ADC12 prices have been declining since June, and the price spread between Chinese and overseas markets is gradually narrowing. If the import profit window opens later, overseas resources are expected to flow in gradually, providing some supplement to domestic supply.
Demand side, in early Q3, the market is still in the traditional consumption off-season. Downstream procurement is expected to remain restricted to essential needs, with the market mainly digesting inventories, and prices will continue to move sideways. From late Q3 to Q4, as the traditional peak season for end-use industries such as automobiles kicks off, if orders show substantial improvement, the ADC12 price center may stage a phased uptick. If demand recovery falls short of expectations, the market will remain in a weak supply-demand pattern, with high costs continuing to cap the downside for prices.
As for price spreads, the driving logic of the ADC12-A00 spread in 2026 has gradually shifted from demand-driven to cost-driven.In early H1, the spread mainly fluctuated around primary aluminum price movements. Since Q2, supported by costs, ADC12 has shown significantly stronger resilience than A00, and their spread has continuously widened to hit a record high for the same period in history. In H2, if the tight aluminum scrap supply and high compliance cost situation does not fundamentally improve, ADC12’s resistance to declines relative to A00 will persist, and the spread is highly likely to stay high. If tax policies improve and aluminum scrap supply becomes ample later, the spread may stage a phased narrowing.
Overall, H2 ADC12 prices are expected to move sideways at high levels, with the supply-demand tight balance persisting. Going forward, close attention should be paid to tax invoice policy changes, the pace of aluminum scrap supply recovery, the opening of import windows, the realization of end-use demand from automobiles and other sectors, aluminum price trends, and the transmission impact of macro sentiment changes on the market.

![Macro sentiment hedge weighs on the rise; China destocking accelerates, supporting the aluminum price bottom [SMM Aluminum Morning Brief]](https://imgqn.smm.cn/usercenter/NQyKF20251217171655.jpg)
![Off-Season Demand Hard to Improve; Aluminum Alloy Prices Mainly Move Sideways [SMM Cast Aluminum Alloy Morning Comment]](https://imgqn.smm.cn/usercenter/aezhG20251217171650.jpg)