Chapter 1: The Energy Crisis Reshapes Coking Coal Value
In 2026, with the Russia-Ukraine war still ongoing and the U.S.-Iran war reigniting, crude oil price centers continued to shift upward. Coupled with persistent geopolitical conflicts in other regions worldwide, energy security demand climbed, driving a systematic revaluation of coking coal value. Moreover, against the backdrop of high oil prices, the cost advantages of coal-based chemicals over oil-based chemicals began to emerge, improving the economics of coal-to-oil substitution and expanding coking coal demand.
Coking coal possesses the dual attributes of industrial raw material and energy commodity, supported by both rigid demand and high elasticity to energy prices, with premium capacity far exceeding that of ordinary industrial products. Market perception underwent a fundamental shift, as coking coal gradually shed its subordinate positioning within the steel industry chain and was upgraded to a scarce strategic energy asset.
The energy crisis restructured its valuation logic. Pricing broke free from the singular steel supply-demand framework and was incorporated into the global energy price comparison system. Energy and security premiums elevated the valuation center, making it an important target for hedging geopolitical risks and allocating strategic resources.
Chapter 2: Global Coking Coal Market Landscape
(1) Global Coking Coal Resource Distribution
Data source: publicly available data
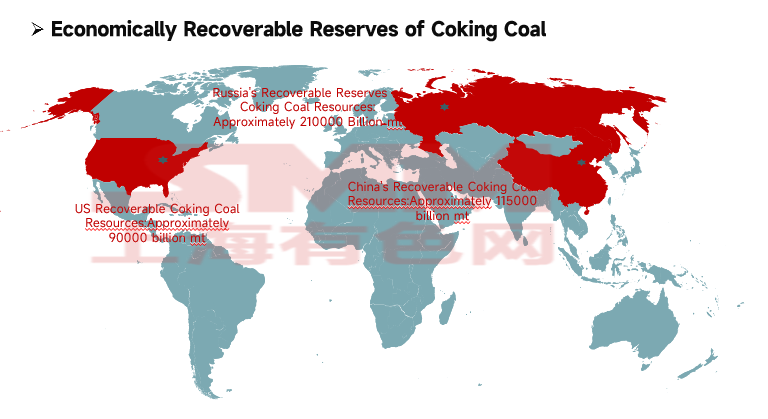
Global coking coal resources account for 13% of total global coal resources, approximately 1,140 billion mt. About 49% are distributed in Europe, 29% in Asia, and 19% in North America. The economically recoverable reserves of coking coal are approximately 500 billion mt, of which high-quality coking coal with low ash and low sulfur content amounts to only about 60 billion mt.
Economically recoverable coking coal resources are primarily concentrated in three countries: Russia (42%, approximately 210 billion mt), China (23%, approximately 115 billion mt), and the US (18%, approximately 90 billion mt), with other countries accounting for relatively small shares.
(II) Global Coking Coal Production Distribution
Data source: publicly available data
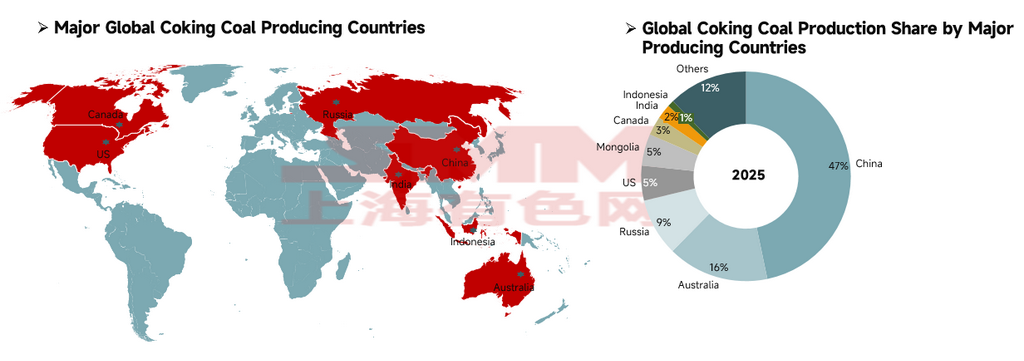
Global coking coal production in 2025 was approximately 1.1 billion mt, with a highly concentrated production landscape. China ranked first at 514 million mt, accounting for 47% of global production and serving as the core supply pillar, though virtually all output was consumed domestically. Australia (172 million mt) and Russia (98 million mt) ranked second and third, followed closely by the US (59 million mt), Mongolia (54 million mt), and Canada (32 million mt), while India produced 25 million mt and Indonesia produced 11 million mt. These eight countries collectively accounted for 88% of global coking coal production.
Data source: World Steel Association, IEA
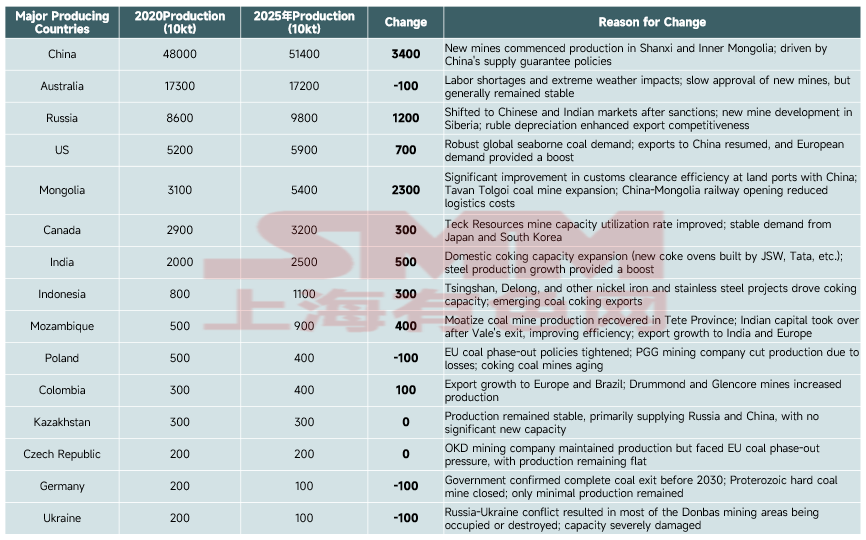
Major producing countries: China firmly held the top global position with absolute volumes rising from 480 million mt (2020) to 514 million mt (2025), achieving the highest global increase of 34 million mt, primarily driven by new domestic mine commissioning and supply security policies. Russia and Mongolia became key growth contributors with increases of 12 million mt and 23 million mt respectively — the former benefiting from post-sanction market redirection and new mine development, while the latter achieved substantial production increases through upgraded border customs clearance with China and railway cost reductions. Australia's capacity remained basically flat.
EU countries (Germany, Poland) and Ukraine continued to cut production due to factors such as coal phase-out policies, aging mines, and geopolitical conflicts, while the US, India, Mozambique and other countries achieved capacity growth driven by export demand and downstream industry boost.
(III) Analysis of Global Coking Coal Export Trade
Data source: publicly available data
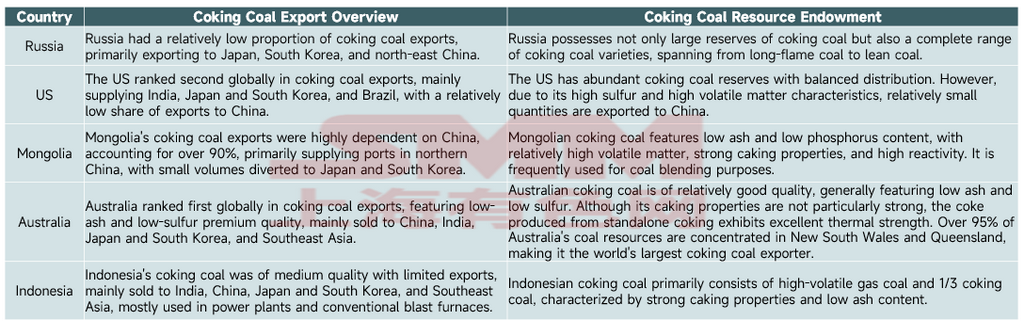
Global coking coal export trade is highly concentrated in five countries—Australia, Russia, Mongolia, the US, and Indonesia—primarily for the following reasons:
Monopolistic resource endowment: Russia accounts for 42% of the world's recoverable coking coal reserves, and the US accounts for 18%. Australia possesses globally scarce high-quality coking coal resources with low ash and low sulfur content. Mongolia and Indonesia also have distinctive coal varieties suited to blending needs. These resource barriers create a supply-side monopoly.
Locational and logistics cost advantages: Australia's coking coal producing regions are adjacent to east coast ports, enabling low-cost seaborne access to the world's core steel-producing regions. Mongolia's mining areas border China, with overland logistics providing direct access to the Chinese market. Russia, the US, and Indonesia leverage mature seaborne and cross-border railway networks to achieve efficient coverage of global demand markets.
Industrial structure and supply-demand mismatch: Although China holds 23% of the world's coking coal reserves, as the world's largest steel producer, China has extremely rigid coking coal consumption demand, making it the world's largest coking coal importer. In contrast, the five countries mentioned above have limited domestic consumption and surplus coking coal supply. Their industrial structures are centered on resource exports, providing a supply foundation for large-scale exports.
Coal quality and global demand matching: The coal varieties from these countries form a complementary supply system. Australian coal is suited to high-end coke demand, Mongolian coal serves as a premium blending raw material, Russian coal covers the full range of varieties, and US and Indonesian coal meet the blending needs of different steelmaking processes. This precisely matches the rigid blending needs of global steel enterprises, forming a stable export pattern.
Chapter 3: China's Coking Coal Market
(1) Current Supply and Demand of Coking Coal in China
Data sources: National Bureau of Statistics (NBS), General Administration of Customs of China, publicly available data
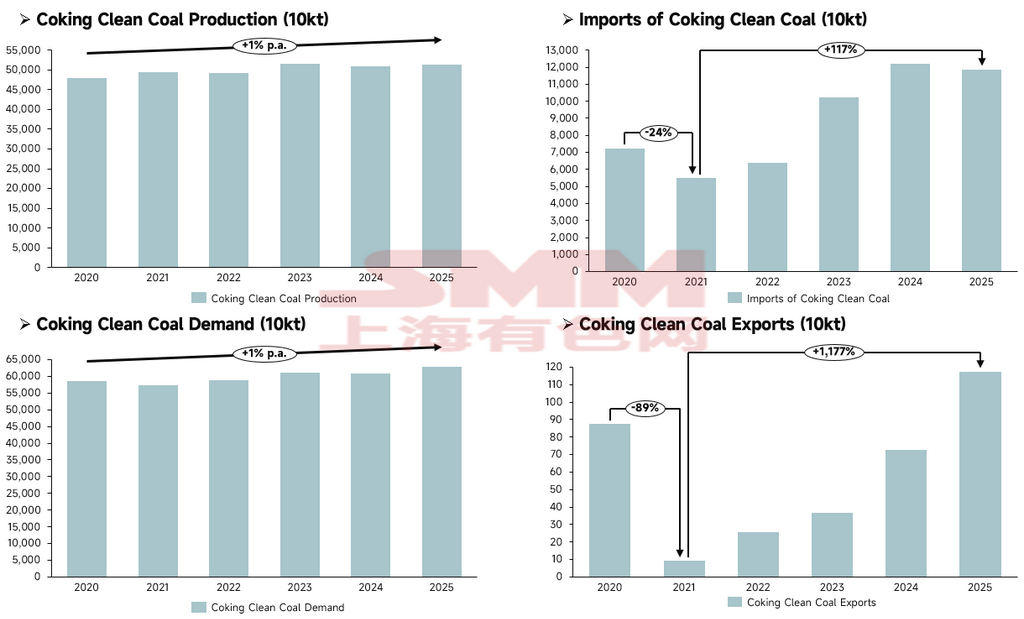
Supply side, China's coking coal concentrate production grew steadily, rising gradually from 480 million mt in 2020 to 514 million mt in 2025, with overall supply scale remaining stable and no wild swings observed.
Import and export side, imports became the core variable supplementing China's domestic supply: imports briefly declined 24% YoY to 54.768 million mt in 2021, then entered a sustained expansion trajectory, with 2025 imports surging 117% from 2021 to 118 million mt; exports remained at low levels over the long term, once plunging 89% YoY to 92,000 mt in 2021, then gradually rebounding, but the 2025 export volume of 1.175 million mt had minimal impact on the overall market.
Demand side, coking coal concentrate demand also maintained mild growth, with 2025 demand reaching 628 million mt, a modest increase from 2020. Demand growth was primarily supported by the concurrent expansion of coke production (coke production reached 502 million mt in 2025). Overall, China's domestic coking coal production growth was unable to fully match demand expansion, with imported resources effectively filling the supply-demand gap.
(II) China's Coking Coal Supply-Demand Balance
Data source: National Bureau of Statistics (NBS), publicly available data
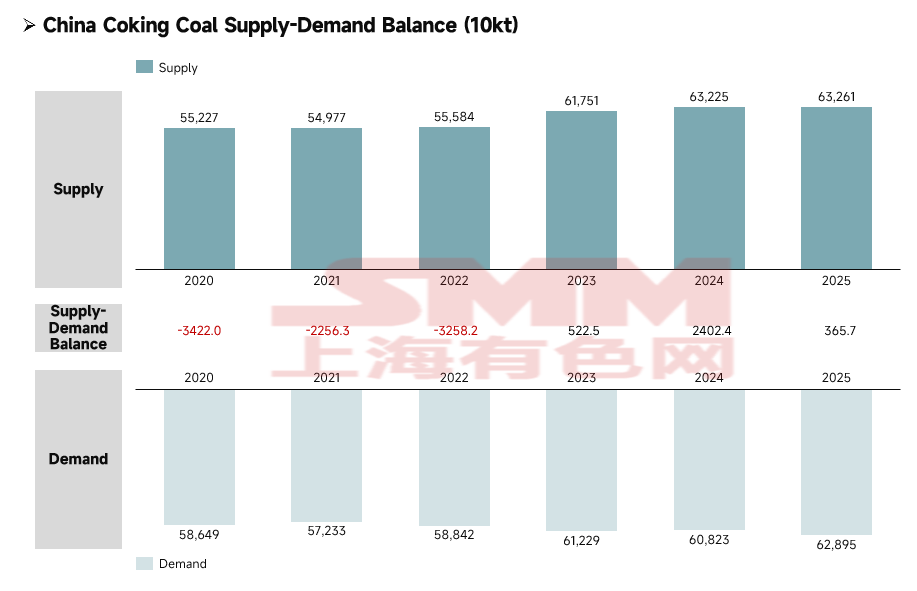
From 2020 to 2025, China's coking coal concentrate market completed a transition from tight supply to a tight balance with a slight surplus, with both supply and demand expanding simultaneously and market operational stability improving significantly.
The supply side exhibited a sustained and steady growth trend, with the release of domestic capacity combined with supplementary import resources jointly driving continuous enhancement of supply capability. The demand side maintained mild expansion, primarily supported by rigid production demand from the coke and steel industries, with overall growth notably slower than the supply side.
By phase, from 2020 to 2022, the market was in a state of persistent undersupply, with supply gaps appearing in all three years, and the industry was highly reliant on imported resources to fill the supply-demand gap. In 2023, the market reached a structural turning point, achieving a supply surplus for the first time; in 2024, the surplus scale expanded significantly; in 2025, the surplus pulled back, but the market had thoroughly shed its prolonged deficit status. With China's coking coal concentrate supply assurance capability continuing to improve, combined with flexible adjustment of import channels, the market entered a healthy tight balance range where supply was slightly greater than demand.
Chapter 4: Global Coking Coal Supply-Demand Balance
Data source: IEA, publicly available data
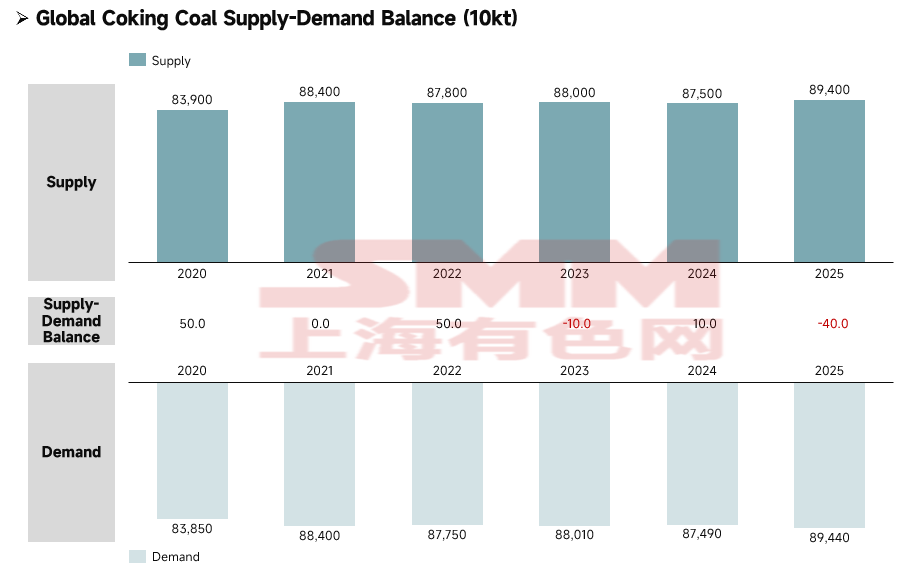
From 2020 to 2025, the global coking coal market gradually shifted from maintaining a slight surplus to a slight supply-demand deficit. The long-term tightening of global premium coking coal resources, compounded by multiple external factors such as the restructuring of the global energy landscape triggered by the energy crisis and shifts in national energy policies, ultimately drove the global coking coal market from a relatively loose state in the earlier period to a slight deficit.
Chapter 5: Summary
Affected by geopolitical conflicts and energy transition, the strategic value of coking coal continued to rise, with energy security premiums becoming prominent, and the overall industry landscape gradually evolving toward a tight supply-demand balance. Global coking coal production is limited, with low-ash, low-sulfur premium resources being particularly scarce. Reserves, capacity, and export trade are all highly concentrated, with a few countries such as Russia, China, the U.S., and Australia controlling the supply side, forming a monopolistic landscape through advantages in resources, logistics, and coal grade complementarity, while the energy crisis brings new opportunities and challenges.
Overall, coking coal markets both in and outside China have shifted toward a tight balance, with structural shortages of premium coal grades being a prominent issue. The coking coal market may hold up well throughout 2026.

![[SMM HRC Daily Trading Volume] Spot Trading Volume Retreats from Highs](https://imgqn.smm.cn/usercenter/niwZw20251217171715.jpg)