According to the latest customs data, in January 2026, China’s imports of copper-zinc alloy (brass) bars and rods were 2,050.01 mt in physical content, down 8.37% MoM and up 24.53% YoY. In February, China’s imports of copper-zinc alloy (brass) bars and rods were 1,344.87 mt in physical content, down 34.4% MoM and down 36.67% YoY, showing an overall sharp decline. Cumulative imports in January-February 2026 were 3,394.87, down 9.94% YoY cumulatively. (HS codes 74072111, 74072119, 74072190).
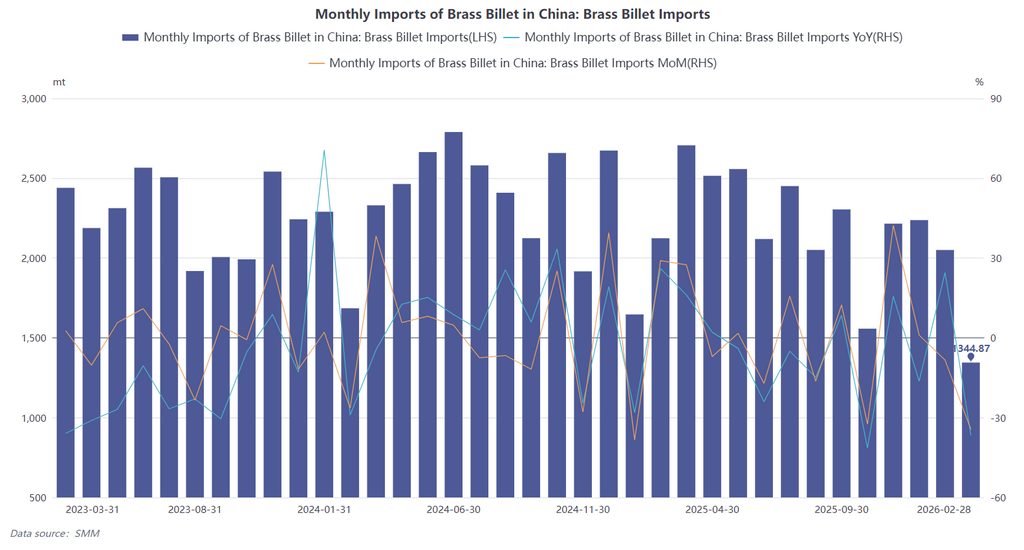
The Chinese New Year holiday in 2026 fell in February, significantly shortening effective production time, which was one of the reasons for the sharp drop in imports in February. In addition, persistently high raw material costs clearly suppressed import demand. Judging from operating conditions, the post-holiday resumption pace in the brass billet industry was also noticeably slower than in previous years.
It is worth noting that the continuously escalating geopolitical conflict in the Middle East since 2026 has already caused substantial disruption to the global non-ferrous metals supply chain. The rise in energy prices and increase in transportation costs caused by geopolitical conflict are putting pressure on brass processing enterprises from the cost side.
The import source landscape changed, with South Korea still ranking first but posting a significant decline: In terms of import origins, South Korea remained China’s largest source of brass billet imports, leading in the share of cumulative imports in January-February. Imports in January were 815.33 mt, down 12.55% MoM and up 15% YoY. Imports from South Korea in February were 414.98 mt, down 49.1% MoM and down 56.35% YoY, accounting for 30.86%. Japan ranked second, with February imports at 306.87 mt, down 34.23% MoM and down 19.36% YoY, accounting for 22.82%. Notably, Indonesia performed strongly, with February imports reaching 258.54 mt, up both MoM and YoY, with YoY growth of 42.8%, and its share rising to 19.22%, surpassing other traditional sources to become the third-largest source country. This change reflected the diversification of China’s brass billet import sources, with supply capability in Southeast Asia improving.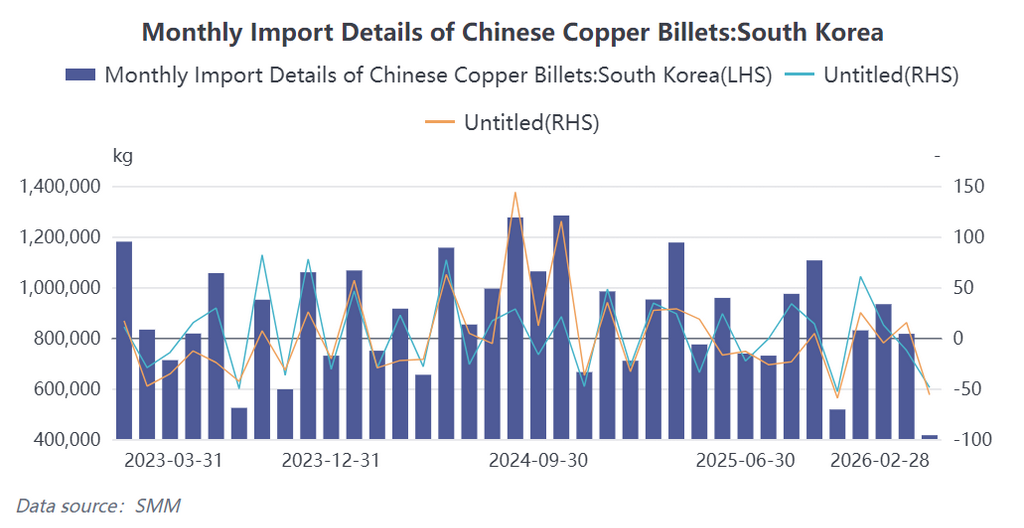
The decline in import value was smaller than that in imports, reflecting higher unit prices: In terms of import value, January import value was $17.64 million, down 5.43% MoM but up 43.58% YoY. February import value was $12.65 million, down 28.26% MoM and down 19.78% YoY, with the decline significantly smaller than the YoY decline in imports (36.67%), reflecting a YoY increase in the import unit price of brass billet. Cumulative import value in January-February 2026 was $30.29 million, up 7.96% YoY.
Looking ahead, the brass billet market will still face the phased predicament of “high costs, low demand, and weak expectations” in the short term, and the brass billet import market in Q1 2026 is expected to remain at a low level.

![China’s Copper Anode Imports Edged Up YoY in January-February 2026, with Growth Expected in Q2 [SMM Analysis]](https://imgqn.smm.cn/usercenter/XTMPt20251217171713.jpeg)