The "Nomadic Era" of Recycled Copper Trade
With the comprehensive shift in Malaysia’s policy and the implicit rise in Thailand’s administrative barriers, the "Golden Age" of Southeast Asia as the global transit hub for recycled copper is entering its countdown.
Since 2018, the global recycled copper trade has entered a highly volatile "Nomadic Era." Against the backdrop of China’s stringent restrictions on solid waste imports, Southeast Asia quickly filled the gap in the global supply chain, leveraging its geographical advantages and relatively loose early-stage regulations. However, this prosperity—built upon "regulatory troughs"—is gradually transforming as regional environmental awareness awakens and administrative logic shifts.
I. China: "Capacity Outflow" Amid Surging Demand
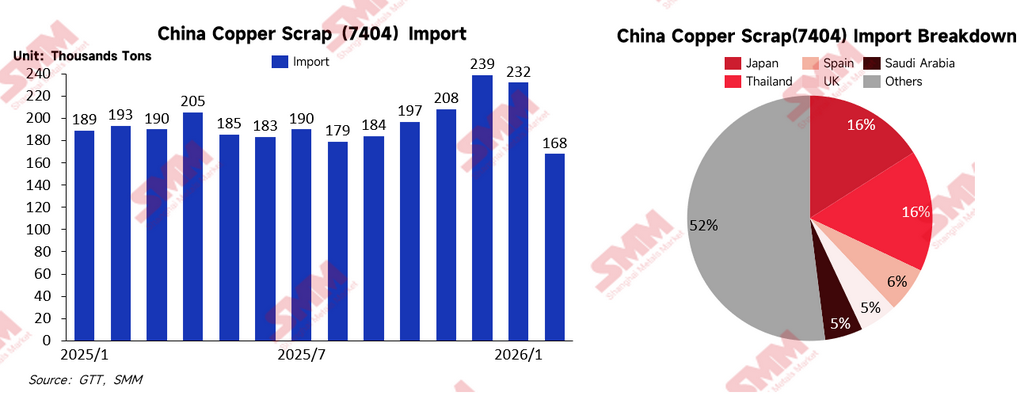
Driven by the waves of New Energy and AI, the demand for copper resources in China’s manufacturing sector has reached unprecedented heights, far outstripping the capacity of domestic recovery systems. Furthermore, the high-entry "red lines" established by China have objectively become a key catalyst for the restructuring of the Asian recycled copper trade map, forcing low-grade scrap to migrate toward Southeast Asia for pre-processing.
Driven by the dual pressures of cost and tightening compliance, the trend of shifting capacity to Thailand, Indonesia, and Vietnam is becoming increasingly prominent. In the future, as resource protection policies in exporting countries tighten, China’s recycled copper imports are expected to undergo a structural shift from raw materials to blister copper and anode copper. Although physical import volumes may retreat from their peaks, China’s position as the bellwether of the global recycled copper market remains undisputed.
II. Malaysia: From "Transit Hub" to "High-Standard Entry Zone"
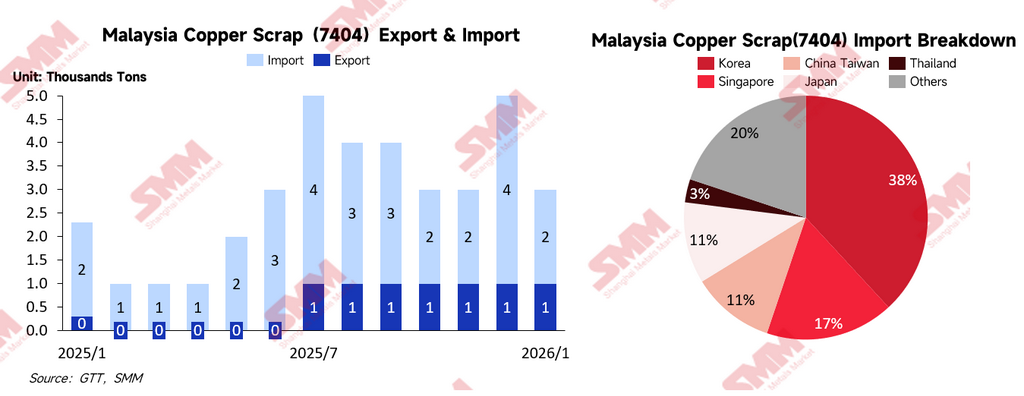
Malaysia was once the heart of recycled copper processing in Southeast Asia. However, with the comprehensive enforcement of SIRIM standards and the tightening of on-site audit systems, the country has effectively completed a "hard exit" for low-end dismantling operations. Currently, Malaysia’s policy orientation is clear: eliminate low-end capacity and retain high value-added processing. While this transition has purified the local industrial environment, it has also forced enterprises with lower compliance-cost tolerance to migrate to Indonesia, Thailand, and Vietnam.
It is noteworthy that, due to the limitations of administrative statistical methods and non-standardized factors in trade declarations, official export data from Malaysia often shows a significant "statistical misalignment" with actual trade volumes. For instance, Malaysia’s monthly statistics for recycled copper exports often hover around a thousand tons, while China’s customs records for imports from Malaysia frequently exceed the ten-thousand-ton mark. This phenomenon reflects a need for higher granularity in local trade statistics and suggests that complex administrative coordination logic in the clearing process has significantly interfered with the accuracy of official data.
III. Thailand: A Surge in "Administrative Coordination Costs"
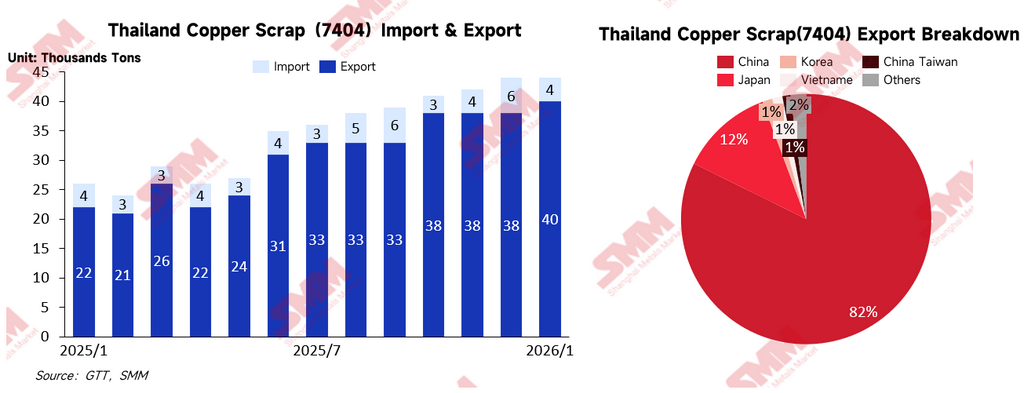
Since 2025, Thailand’s recycled copper import and export volumes have fluctuated significantly, and the market has perceived a tightening of policy. However, in-depth research reveals that this "tightening" does not stem entirely from changes in explicit laws, but rather from complex inter-departmental functional friction.
As recycled copper imports involve VAT (Value Added Tax) verification, a subtle misalignment exists between the Customs department (responsible for tax oversight) and the Ministry of Industry (responsible for production permits and environmental emissions) regarding their jurisdictional boundaries and management goals. The costs of this internal coordination—born of disagreements over administrative resource allocation and enforcement interpretation—are ultimately transferred to the enterprises. By strengthening environmental inspections and permit reviews, the Ministry of Industry has effectively raised "administrative friction costs" for the entire industry. For traders, this is more challenging than explicit policy tightening, as it creates immense uncertainty, leading to decreased clearing efficiency and dampened compliance expectations.
IV. Future Market Directions
As the Malaysia-Thailand dual channels face high-pressure regulation, where will recycled copper flow within the Asian market?
India: A "Complex Maze" of High Growth
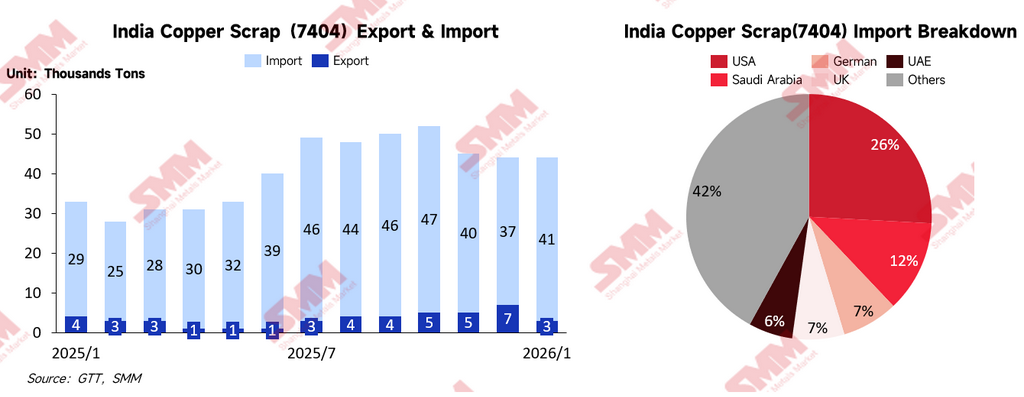
As one of the world's fastest-growing economies, India’s explosive demand for copper has driven a continuous rise in recycled copper imports. However, India’s challenges lie in its complex bureaucracy, volatile BIS standards, and relatively low contract fulfillment rates. For traders seeking stable supply, India remains a "high-reward, high-risk" gambling ground.
Japan: A Safe Haven of Certainty
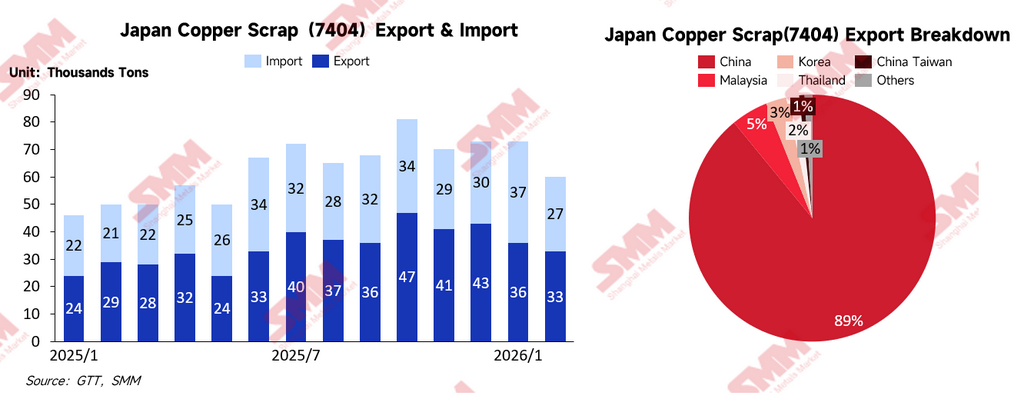
As a veteran mature market, Japan offers a transparent legal framework. Compared to Southeast Asia, the risk of "grey areas" or temporary administrative friction is significantly lower. Furthermore, Japan’s precision dismantling technology and high compliance credit have led to a rediscovery of its value as a "stable market" amidst the uncertainty of Southeast Asia.
South Korea: A Processing Sanctuary with High Premiums
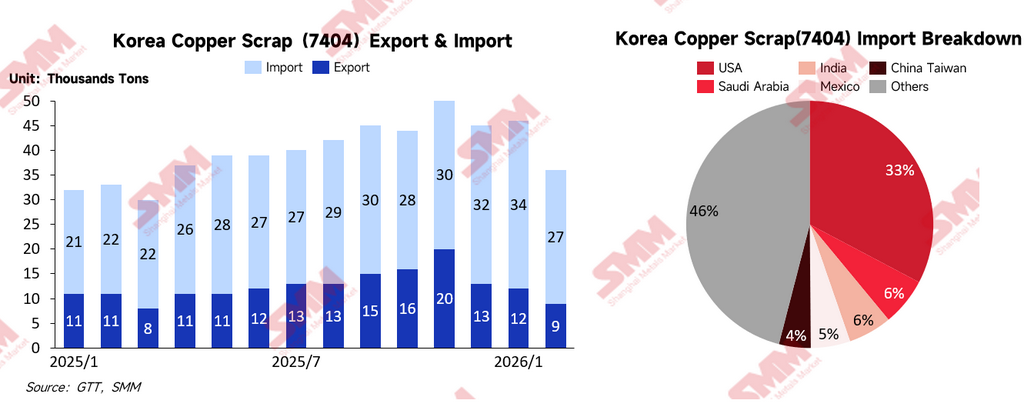
South Korea possesses a mature smelting industry and downstream manufacturing base (such as copper foil and rod plants). With global copper prices remaining high, South Korean downstream enterprises have demonstrated strong absorption capacity and competitive bidding power for recycled copper. However, it should be noted that South Korean customs have recently cracked down on illegal exports and tax fraud to prioritize domestic industrial supply, thereby raising the threshold for re-export.
Indonesia: An Emerging Blue Ocean
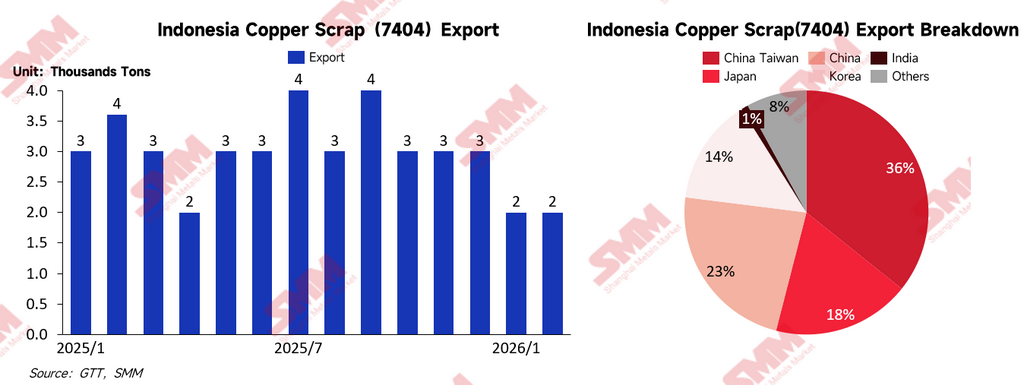
Indonesia’s strong manufacturing foundation and relatively friendly initial entry conditions are attracting significant foreign investment. However, a potential risk is the "copycat effect"—whether Indonesia will follow the footsteps of Thailand and Malaysia by tightening policies once the industry reaches a certain scale. This remains a point of high vigilance for investors.
Vietnam: Import Controls via "Red-Headed Documents"
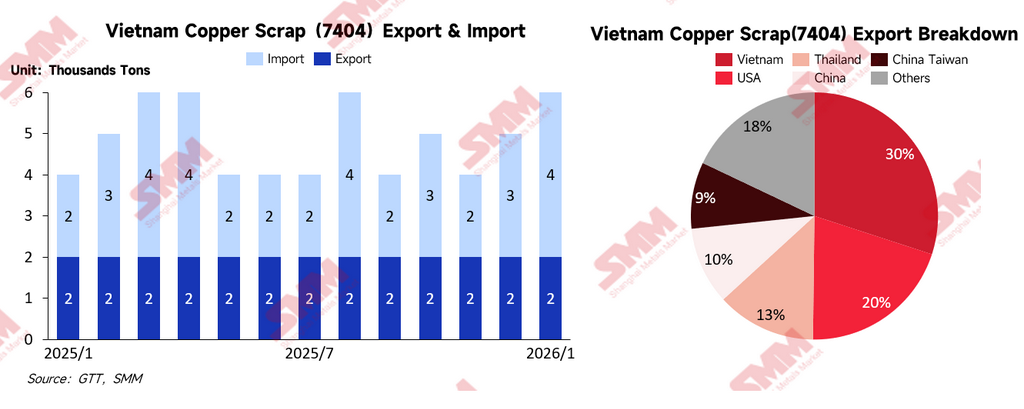
The core of Vietnam’s regulation lies in its permit thresholds. Recycled copper imports require government-issued permits, known as "Red-Headed Documents," which strictly link import quotas to a plant's actual production capacity. While some traders continue to operate by cooperating with "permitted plants," the implementation of the QCVN 66:2024 environmental standard has led to stricter crackdowns on "importing without processing," causing this grey space to collapse rapidly.
Middle East: The Geopolitical Discount
Countries like the UAE and Saudi Arabia have been active in the recycled metal sector, offering clear energy cost advantages. However, affected by the recent Red Sea crisis and regional instability, logistics security remains an unavoidable bottleneck. Furthermore, market concerns regarding contract fulfillment rates present obstacles to the region becoming a mainstream market in the short term.
V. Tax Cost Models of Major Asian Markets
In the restructuring of the global recycled copper supply chain, tax structures are key determinants of trade flows. Beyond explicit VAT and tariff costs, export restrictions and the efficiency of Input Tax Credit (ITC) systems are core indicators. The table below outlines the tax structures for recycled copper (HS 7404) across major Asian trading nations, providing a reference for enterprises seeking the most economic and compliant paths amidst complex policy maneuvering.
| Region |
VAT/GST/SST |
Import Duty |
Export Duty |
|
China |
13% |
0% |
30% |
|
Malaysia |
10%(SST) |
0% |
10% |
|
Thailand |
7% |
0% |
10% |
|
Vietnam |
8% |
0% |
22% |
|
Indonesia |
11% |
0% |
5% |
|
Korea |
10% |
0% |
0% |
|
India |
18% |
0% |
0% |
|
Japan |
10% |
0% |
0% |
VI. Conclusion: From "Seeking Troughs" to "Deepening Compliance"
The migration history of Asia’s recycled copper trade is essentially a countdown of diminishing policy dividends. The "grey areas" of the trade are being systematically dismantled by increasingly formalized administrative logic across all nations. Whether it is China’s high-standard "push," Thailand’s functional friction, South Korea’s tax audits, or Vietnam’s regulatory tightening, all signs point to one signal: the recycled copper trade is moving from an era of "wild growth" into an era of "compliant operation."
The core competitiveness of the future market will no longer be determined by who can find the region with the loosest oversight, but by who can most quickly adapt to and integrate into the increasingly standardized administrative and environmental logic.