SMM March 25 News:
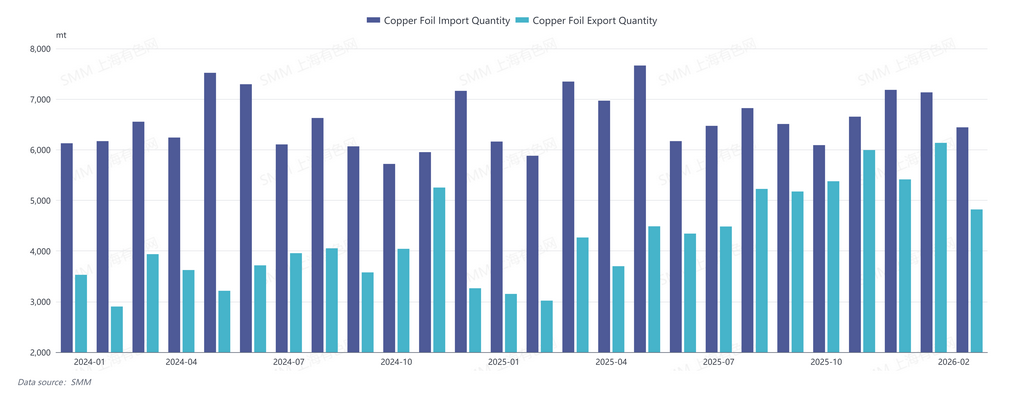
According to data from the General Administration of Customs, China's copper foil (HS codes: 74101100, 74102190) imports were 7,133.71 mt in January 2026, up 15.77% YoY and down 0.69% MoM; imports were 6,442.72 mt in February, up 9.55% YoY and down 9.69% MoM; cumulative imports of copper foil in China for January-February 2026 were 13,576.44 mt, up 12.73% YoY.
China's copper foil exports were 6,136.04 mt in January 2026, up 94.70% YoY and up 13.33% MoM; exports were 4,820.50 mt in February, up 59.68% YoY and down 21.44% MoM; cumulative exports of copper foil in China for January-February 2026 were 10,956.54 mt, up 77.57% YoY.
China's copper foil import value was $134.53 million in January 2026, up 25.42% YoY and down 0.02% MoM; China’s copper foil import value was $132.92 million in February, up 27.19% YoY and down 1.20% MoM; cumulative import value of copper foil in China for January-February 2026 was $267.45 million, up 26.29% YoY.
China's copper foil export value was $90.40 million in January 2026, up 126.64% YoY and up 18.23% MoM; China’s copper foil export value was $73.91 million in February, up 98.06% YoY and down 18.24% MoM; cumulative export value of copper foil in China for January-February 2026 was $164.31 million, up 112.83% YoY.
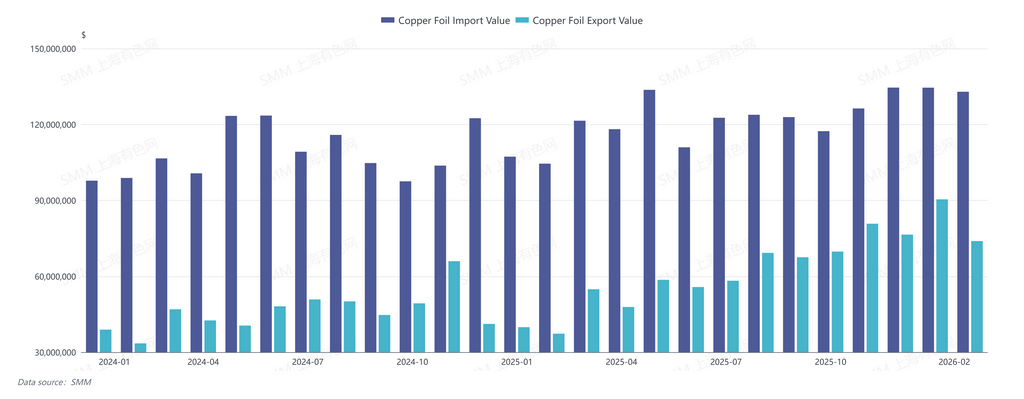
China's copper foil import-export trade deficit was about $44.13 million in January 2026 and about $59.01 million in February. The trade deficit for January-February 2026 totaled $103.14 million, down about $31.43 million YoY from $134.57 million in January-February 2025.
By trade mode, China imported 4,877.05 mt of copper foil through Ordinary Trade in January 2026; 400.7 mt through processing trade with supplied materials; 861.73 mt through processing trade with imported materials; and 994.24 mt through other trade modes. In February, China imported 4,604.8 mt of copper foil through Ordinary Trade; 257.71 mt through processing trade with supplied materials; 735.3 mt through processing trade with imported materials; and 844.91 mt through other trade modes.
In January 2026, China exported 1,192.52 mt of copper foil through Ordinary Trade; 1,450.02 mt through processing trade with supplied materials; 3,369.14 mt through processing trade with imported materials; and 124.37 mt through other trade modes. In February, China exported 1,408.74 mt of copper foil through Ordinary Trade; 1,470.77 mt through processing trade with supplied materials; 1,736.49 mt through processing trade with imported materials; and 204.49 mt through other trade modes.
By country, the main import sources of China’s copper foil in January-February 2026 were Taiwan, China, Malaysia, and Luxembourg, with imports of 8,347.43 mt, 2,009.42 mt, and 997.76 mt, respectively.
The main export destinations of China's copper foil in January-February 2026 were Thailand, South Korea, and Vietnam, with exports of 2,713.31 mt, 1,474.16 mt, and 792.21 mt, respectively.
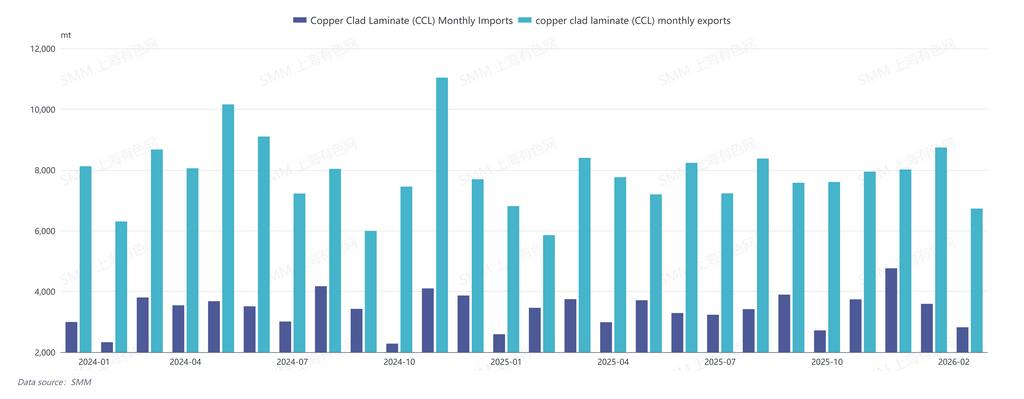
China's imports of copper clad laminate (CCL) (HS code: 74102110) were 3,592.45 mt in January 2026, up 38.63% YoY and down 24.58% MoM; imports were 2,820.74 mt in February, down 18.52% YoY and down 21.48% MoM; cumulative imports of copper clad laminate (CCL) in China for January-February 2026 were 6,413.19 mt, up 5.94% YoY.
China's exports of copper clad laminate (CCL) were 8,739.92 mt in January 2026, up 28.33% YoY and up 9.02% MoM; exports were 6,729.49 mt in February, up 14.92% YoY and down 23.00% MoM; cumulative exports of copper clad laminate (CCL) in China for January-February 2026 were 15,469.41 mt, up 22.13% YoY.
In January and February 2026, China's import and export volumes of both copper foil and copper clad laminate (CCL) posted YoY growth. Supported by continued strong prosperity in the global PCB, NEV, and energy storage industries, demand in and outside China remained optimistic. Capacity at leading copper foil enterprises in China was released, maintaining high operating rates, while their ability to independently develop and produce high-end products improved, resulting in a relatively significant increase in exports.
The copper foil industry chain is expected to maintain high prosperity in 2026. However, attention should be paid to potential energy issues arising from prolonged geopolitical conflicts. For example, power supply in Taiwan, China, Japan and South Korea relies on LNG imports from the Middle East, which may indirectly affect technology industry chains such as AI and electronics.

![China’s Copper Anode Imports Edged Up YoY in January-February 2026, with Growth Expected in Q2 [SMM Analysis]](https://imgqn.smm.cn/usercenter/XTMPt20251217171713.jpeg)