Chinese New Year Factors Affected Brass Bar Imports
Data Source Statement: Except for publicly available information, all other data are processed by SMM based on publicly available information, market communication, and relying on SMM‘s internal database model. They are for reference only and do not constitute decision-making recommendations.
For any inquiries or to learn more information, please contact: lemonzhao@smm.cn
For more information on how to access our research reports, please contact:service.en@smm.cn
Related News

1 hour ago
Data: SHFE, DCE market movement (Mar 23)
Read More
Data: SHFE, DCE market movement (Mar 23)
The following table shows the ferrous and nonferrous metals movement on the SHFE and DCE on 23 Mar , 2026
1 hour ago

Common.Time.hoursAgo
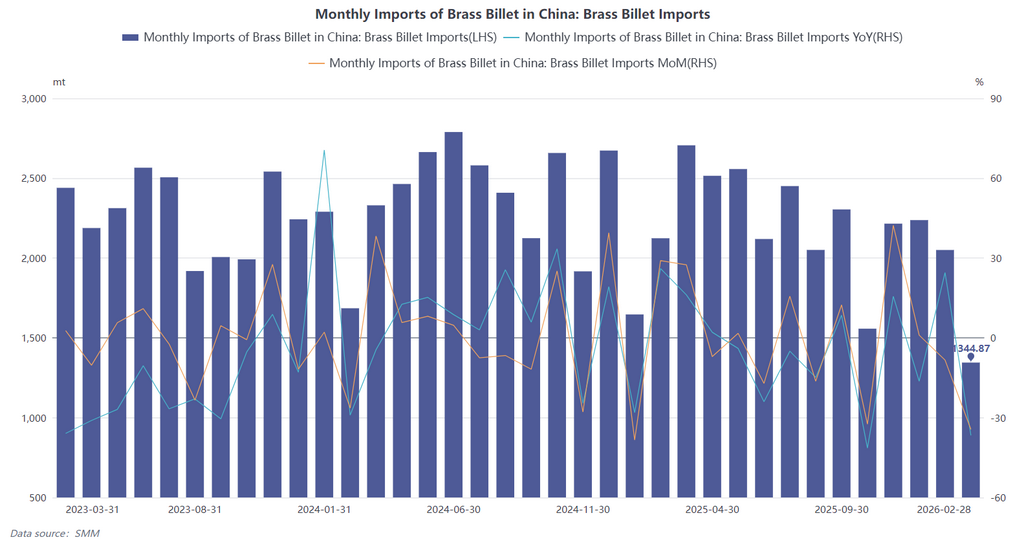
China’s Brass Bar Imports Fell 9.94% YoY, January-February 2026
Read More
China’s Brass Bar Imports Fell 9.94% YoY, January-February 2026
[SMM Brass Bar Flash] According to the latest customs data, China’s imports of copper-zinc alloy (brass) bars and rods stood at 2,050.01 mt in physical content in January 2026, down 8.37% MoM and up 24.53% YoY. In February, China’s imports of copper-zinc alloy (brass) bars and rods were 1,344.87 mt in physical content, down 34.4% MoM and down 36.67% YoY, marking an overall sharp decline. Cumulative imports in January-February 2026 totaled 3,394.87, down 9.94% YoY on a cumulative basis. (HS codes 74072111, 74072119, 74072190).
Common.Time.hoursAgo

Common.Time.hoursAgo
Diversified Sources of Copper Scrap Imports
Read More
Diversified Sources of Copper Scrap Imports
[SMM Flash News] China’s copper scrap import sources showed clear characteristics of “one dominant player with many strong suppliers, and diversified sources.” Japan, Thailand, and Spain have long ranked among the top three, with their core supplier positions remaining solid. Japan: exports to China were 31,200 mt in January, accounting for 13.43%, up 104.94% YoY; exports were 26,600 mt in February, with the share rising to 15.81%, still up 13.93% YoY. Although both months declined MoM, its core supplier position remained unshaken.
Common.Time.hoursAgo
Related News
Data: SHFE, DCE market movement (Mar 23)
Mar 23, 2026 16:01
China’s Brass Bar Imports Fell 9.94% YoY, January-February 2026
Mar 23, 2026 15:29
Diversified Sources of Copper Scrap Imports
Mar 23, 2026 15:23

Seasonal Pullback Does Not Alter Long-Term Resilience: Analysis of January-February 2026 Import Data for Copper Scrap
Mar 23, 2026 15:15