GACC: China’s February Copper Cathode Imports Fell 33.28% YoY, Breakdown Data at a Glance

Published: Mar 20, 2026 19:51

Data released by the online query platform of customs statistics showed that China’s copper cathode imports in February 2026 were 203,588.22 mt, down 18.78% MoM and down 33.28% YoY.

The DRC was the largest origin, with China importing 70,661.8 mt of copper cathode from the DRC during the month, down 33.06% MoM and down 28.63% YoY.

Chile was the second-largest origin, with China importing 25,429.03 mt of copper cathode from Chile during the month, up 8.18% MoM and down 32.18% YoY.

The following is a breakdown of China’s copper cathode imports in February 2026, compiled based on data from the official website of the General Administration of Customs: 

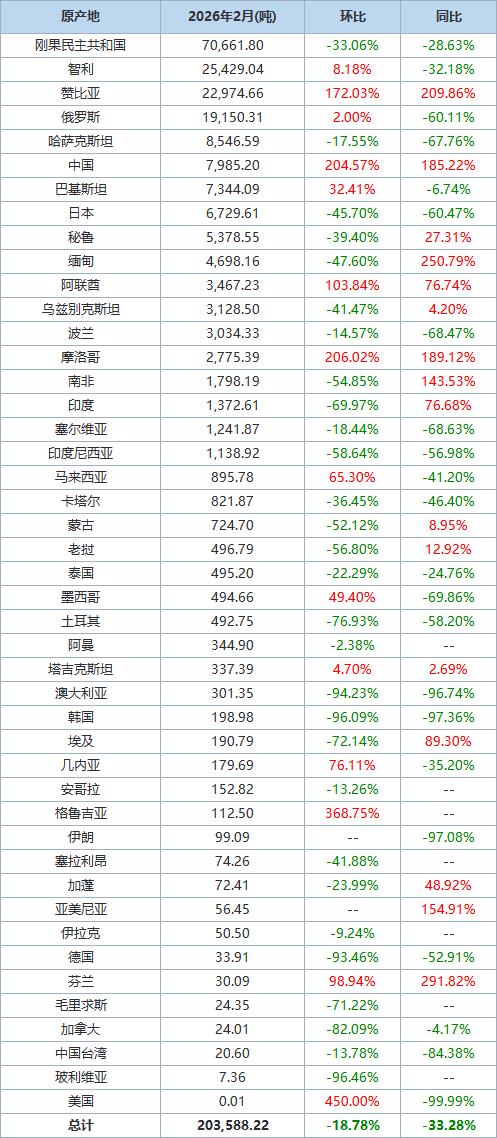
Source: General Administration of Customs

Note: 1. Including unwrought copper cathode with a copper content >99.9935%; unwrought other refined copper cathode; unwrought refined copper wire bars; unwrought refined copper cathode sections; unwrought refined copper billets; and other unwrought refined copper.

2. The total imports (grand total) also include data for some origins not listed in the table above.

(Wenhua Composite)

Data Source Statement: Except for publicly available information, all other data are processed by SMM based on publicly available information, market communication, and relying on SMM‘s internal database model. They are for reference only and do not constitute decision-making recommendations.

For any inquiries or to learn more information, please contact: lemonzhao@smm.cn
For more information on how to access our research reports, please contact:service.en@smm.cn
Related News
China's Copper Plate/Sheet and Strip Exports Dominated by Processing Trade with Imported Materials
1 min ago
China's Copper Plate/Sheet and Strip Exports Dominated by Processing Trade with Imported Materials
Read More
China's Copper Plate/Sheet and Strip Exports Dominated by Processing Trade with Imported Materials
The structure of China’s copper plate/sheet and strip export trade modes continued the characteristics seen in the previous period. Customs data showed that in January-February, processing trade with imported materials remained the core export mode, with exports of 14,335 mt, accounting for 66.3% and firmly maintaining its dominant position; Processing and Assembling exports were 3,655 mt, accounting for 16.9%; Ordinary Trade exports were 2,182 mt, accounting for 10.1%; and other trade modes totaled 1,458 mt, accounting for 6.7%.
1 min ago
Copper Plate/Sheet and Strip Exports
Common.Time.minsAgo
Copper Plate/Sheet and Strip Exports
Read More
Copper Plate/Sheet and Strip Exports
According to data from the General Administration of Customs, China’s copper plate/sheet and strip exports were 13,233.73 mt in January 2026, up 30.59% MoM and up 27.53% YoY; in February, exports were 8,395.28 mt, down 36.56% MoM and up 11.87% YoY. In January-February, China’s cumulative copper plate/sheet and strip exports reached 21,629.01 mt, up 20.96% YoY cumulatively.
Common.Time.minsAgo
Copper Plate/Sheet and Strip Exports: Strong Growth at the Start of 2026, up 20.96% YoY in January-February
Common.Time.minsAgo
Copper Plate/Sheet and Strip Exports: Strong Growth at the Start of 2026, up 20.96% YoY in January-February
Read More
Copper Plate/Sheet and Strip Exports: Strong Growth at the Start of 2026, up 20.96% YoY in January-February
Common.Time.minsAgo