By : James Stanley, Sr. Strategist 03/03/2026
Last week’s open saw gold prices run aggressively higher as the ascending triangle gave way, and after an early week pullback to support at prior resistance, bulls went right back at the bid to create another Friday rally that saw prices push up to a fresh high.
This week, gold again jumped at the open and this time there was a very obvious fundamental reason for it, although I’d suggest that this reason had already started to get priced-in given the bullish backdrop in gold that built in the latter half of last week.
In this iteration, gold has run all the way up to the $5400 level, where the move has begun to pause. And this presents a challenging area on the chart to chase the move higher. But, with that being said, given the strength of the breakout there’s the possibility of using short-term momentum to allow for continuation, very similar to what I’ve looked at in webinars for each of the past three weeks.
Last week the support test was at prior resistance of $5100. The week before, it was $4856 and the week before that was the $5k test.
At this point there’s another shorter-term level that’s already in-play at $5325 that I’ll look at in closer detail below.
Gold Four-Hour Chart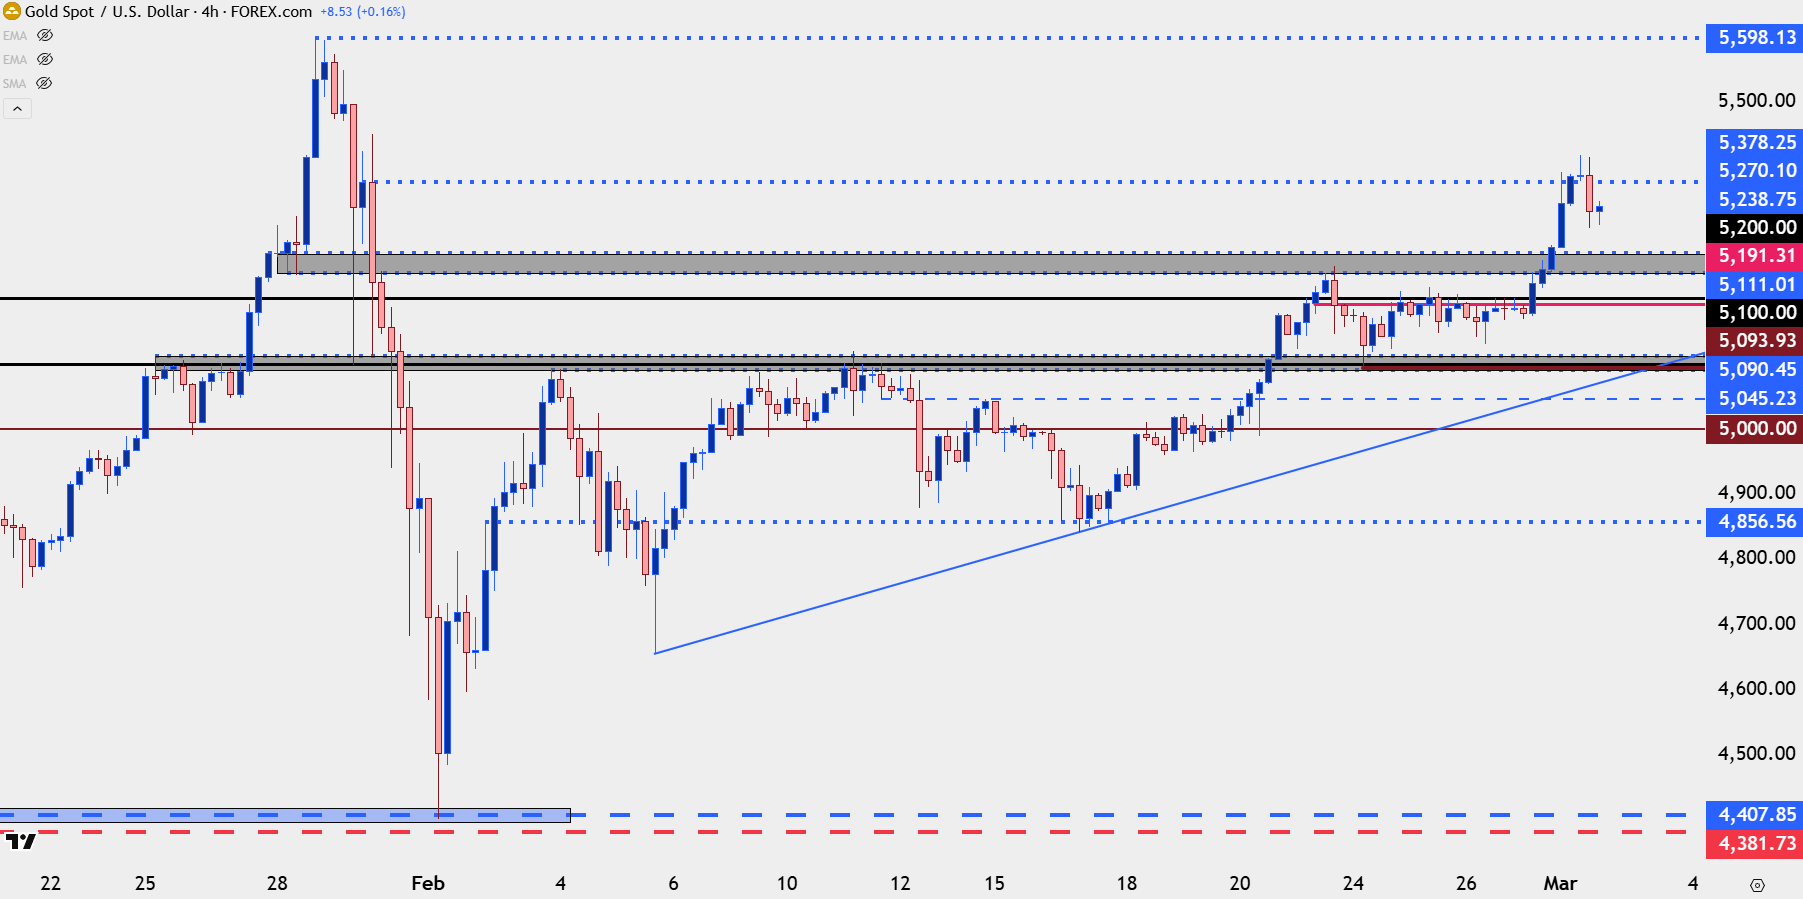
Chart prepared by James Stanley; data derived from Tradingview
Gold Shorter-Term
There hasn’t been much prior history at the current levels in gold and much like trying to find your way through a dark room, grasping on to whatever might be there to retain stability, markets will often grasp on to whatever levels might have some prior relevance.
We’re seeing that at $5325 currently much like we had seen that at $4856 a couple weeks ago.
The more obvious area of emphasis is the prior resistance zone which, again, was a spot of prior price action swings, running between $5238 and $5270. And below that, the zone from $5191-$5200.
This sets up an ‘s1’ an ‘s2’ and an ‘s3’ zone to look for support in order to work with bullish continuation.
As for how to execute – it depends on how aggressive one wants to be. The shorter-term the chart, the higher the probability for noise just given sample sizing. In webinars over the past few weeks I went down to as short as the 30-minute chart, although that can be considered extremely noisy given the small sample sizing.
With that, traders should expect a lower probability of the level holding and, in-turn, a higher potential rate of failure. But, that can be offset with potentially larger reward-to-risk ratios as the shorter-term chart offers the possibility of tighter risk outlays.
Gold Hourly Chart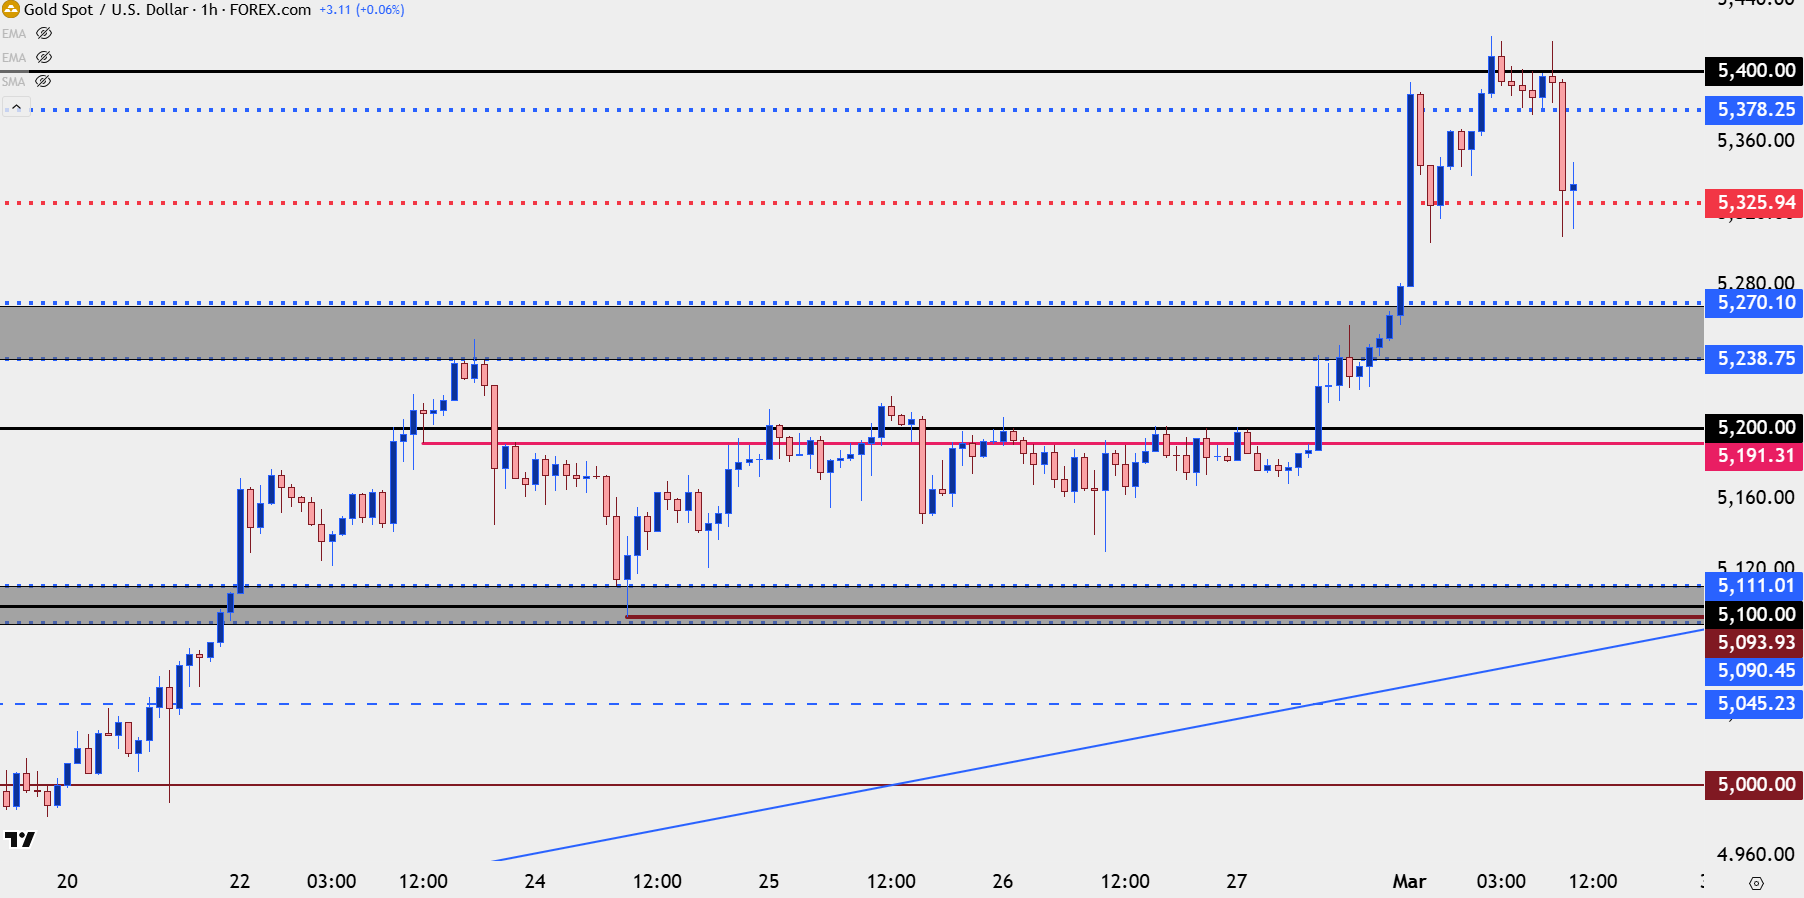
Chart prepared by James Stanley; data derived from Tradingview
Gold Big Picture
The daily chart illustrates the danger of chasing the move at this point as there’s already a wide upper wick on the daily bar. There’s still time before the close of this candle, of course, so that can change, but the fact that the rally has been faded as much as it has already shows how chasing a move can be a dangerous way of working with a trend.
Pullbacks, however, can at the least offer some proximity to support which can allow for risk management.
But, with a trend of this magnitude, I want to continue to bias this as bullish until something obvious changes.
Gold Daily Chart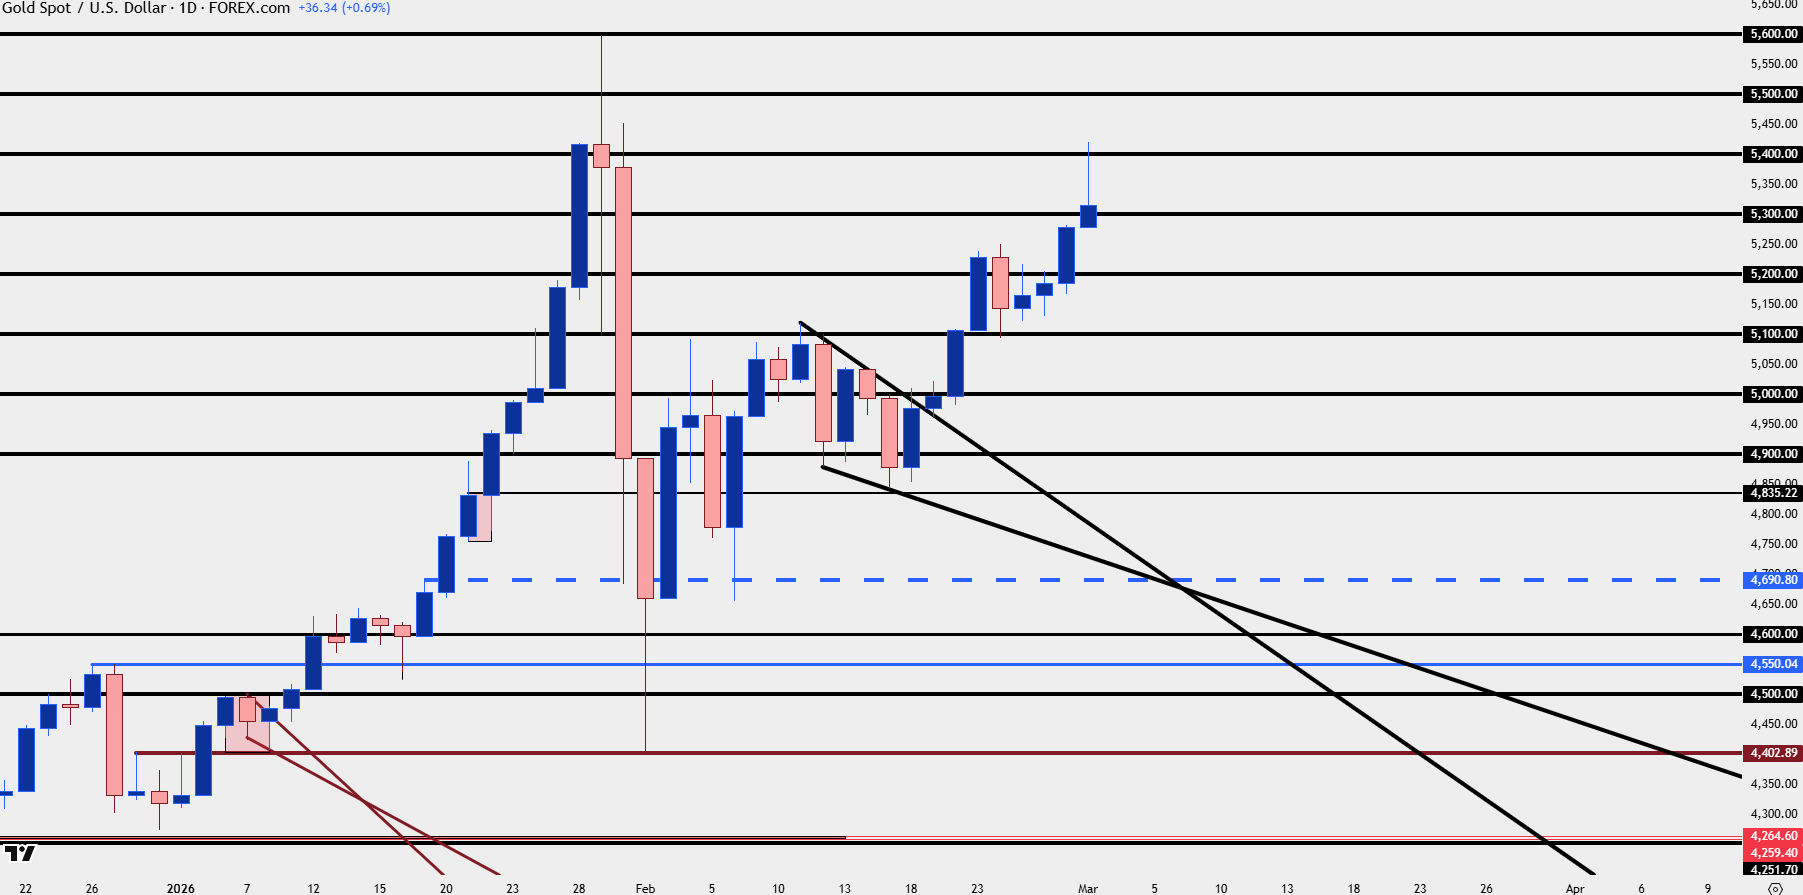
Chart prepared by James Stanley; data derived from Tradingview
--- written by James Stanley, Senior Market Analyst, Global Macro
![Platinum Prices Plunge Intraday Spot Market Transactions Recover [SMM Daily Review]](https://imgqn.smm.cn/usercenter/VphiQ20251217171736.jpg)